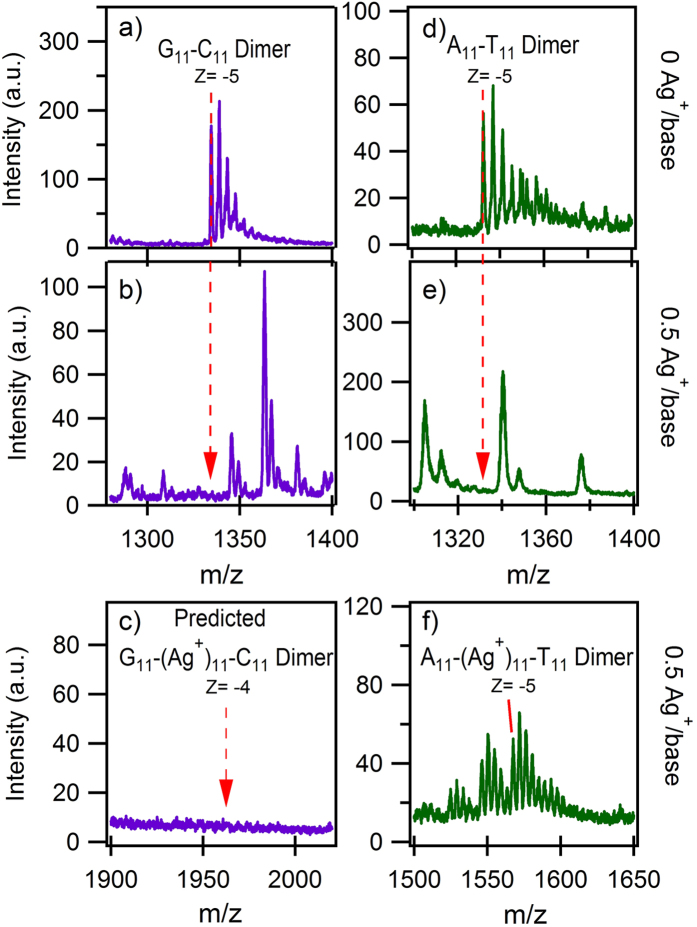
Figure 2.
Effects of Ag+ on solutions of mixed C11 and G11 (a)-(c), and solutions of mixed A11 and T11 (d)-(f), at 40 μM per strand. (a) Mass spectra (MS) of the C11-G11 mixture at 0 Ag+/base and (b) 0.5 Ag+/base. Dashed line: m/z for the WC paired G11-C11 duplex, present in the absence of Ag+ (a) but undetectable after adding Ag+(b). (The peak envelope to higher m/z in (a), (d) and (f) is attachment of Na+ from residual salts). (c) No G11-(Ag+)N-C11 products were detected, exemplified by the absence of G11-(Ag+)11-C11 (expected at dashed line). (d) MS of A11-T11 mixture at 0 Ag+/base and (e) 0.5 Ag+/base. Dashed line: m/z for the WC paired product showing no detectable signal after adding Ag+. (f) A11-(Ag+)N-T11 products did form, exemplified by A11-(Ag+)11-T11 (dashed line). Additional, unlabeled peaks in (b) and (e) are various (Ag+)N-DNA products (see Fig. S1).

