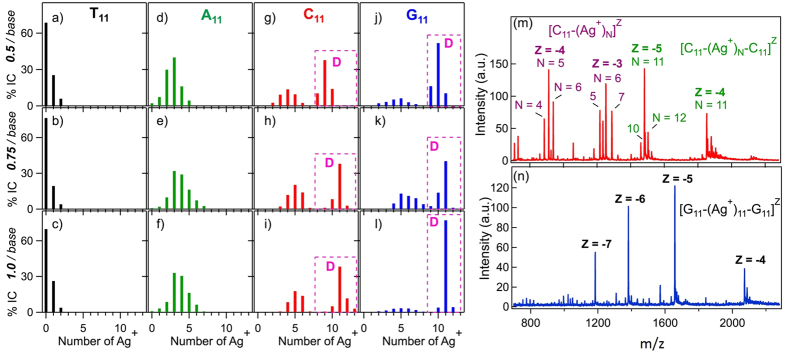
Figure 3.

(a-l) Percentage of the total integrated counts (%IC) for each detected Ag+-bearing DNA product plotted versus number of attached Ag+. Top, middle and bottom rows: solutions with 0.5, 0.75 and 1 Ag+/base. Product yields are qualitatively different depending on base type. The boxed peaks labeled “D” are Ag+-paired duplexes, containing two copies of the strand. All other peaks correspond to strand monomers. Data are for the highest abundance charge state of each product. (a-c) T11 solutions exhibit the bare strand as the major product. (d-f) A11 shows a range of Ag+ attachment to strand monomers and no duplexes. (g-i) C11 exhibits strand monomer and duplex products. (j-l) G11 products are heavily biased to duplexes. The duplex with 11 bridging Ag+, G11-(Ag+)11-G11, is the overwhelming majority product at 1 Ag+/base (l). (m,n) Mass spectra of C11 and G11 solutions at 1 Ag+/base, corresponding to % IC plots i) and l). Major peaks are labeled.
