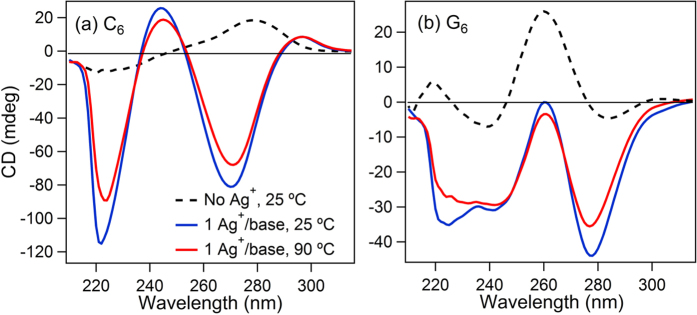
Figure 4.

Circular dichroism (CD) spectra of C6 (a) and G6 (b). Dashed black lines: data for the bare strands at 25 °C. Blue lines: with 1 Ag+/base at 25 °C. Red lines: with 1 Ag+/base at 90 °C. The restructuring of the CD spectra upon addition of Ag+ reflects the reconfiguration of the DNA by incorporation of Ag+. Persistence of the dichroic peaks to the highest temperature accessible experimentally shows that this structural change is thermally robust.
