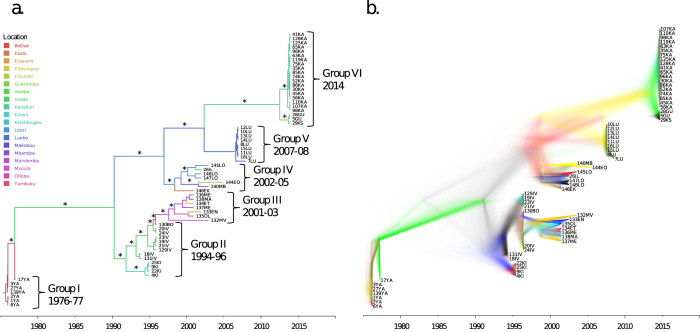
Figure 1. Bayesian MCC genealogy and DensiTree representation of posterior distribution of trees from Bayesian phylogenetic analysis.
(a) Bayesian maximum clade credibility (MCC) tree of EBOV GP gene with branch lengths scaled in time by enforcing a relaxed molecular clock. Strain labels are colored to indicate the sampling location according to the legend in the figure. Branches labeled with an asterisks are well supported, having a posterior probability >0.85. (b) A posterior distribution of trees was obtained from Bayesian phylogenetic analysis of EBOV GP gene using GMRF Skygrid model and relaxed molecular clock as implemented in BEAST v1.8.0. Tip dates for each node represent the year of isolate collection. DensiTree provides a visualization of the posterior distribution of trees and the frequency of node clustering for support of clades in the overall topology. Branches are colored based on distinct clades. Well-supported branches are indicated by solid colors whereas webs represent little agreement.

