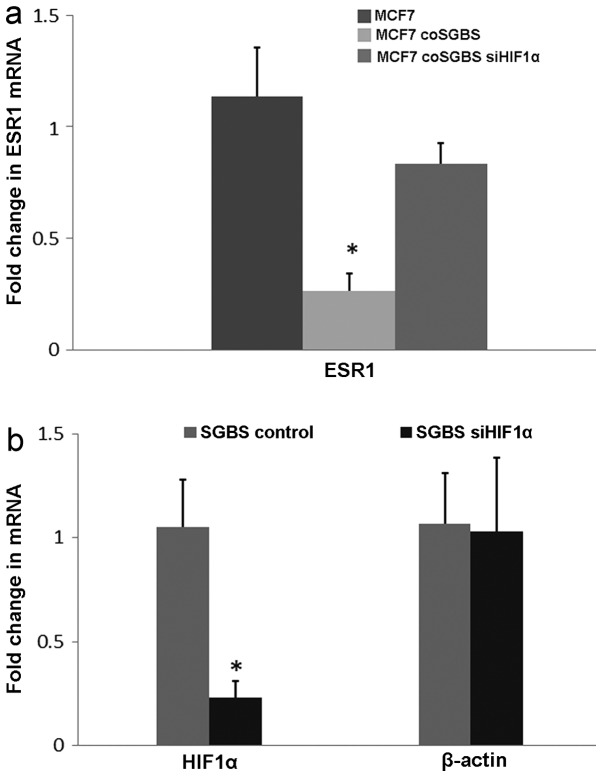
Figure 4.
(a) ESR1 mRNA levels in MCF7, MCF7 co-cultured with SGBS (MCF7 coSGBS) and MCF7 cells co-cultured with SGBS that had been transfected with siRNA against HIF1α (MCF7 coSGBS siHIF1α). Total RNA was extracted for gene expression analysis (n=3 for each mRNA expression level). *P<0.05. (b) Differentiated SGBS cells were treated with siHIF1α as described in Materials and methods. HIF1α knockdown efficiency was determined with RT-PCR in the SGBS cells, *P<0.05. The data were normalized with the 18S RNA level and analyzed with the 2−ΔΔCT method.

