
Figure 1.
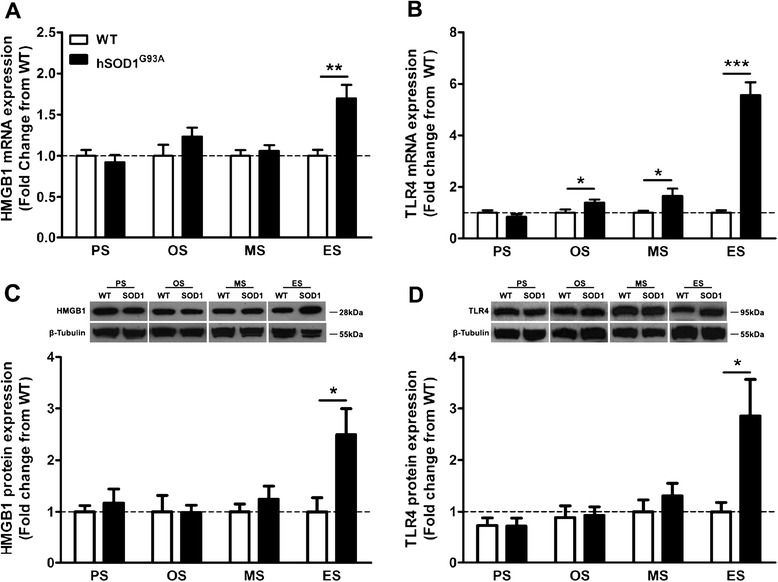
Expression of HMGB1 and TLR4 during disease progression in wild-type and hSOD1G93A mice. (A) and (B) mRNA expression profile of HMGB1 and TLR4 in the lumbar spinal cord of hSOD1G93A mice relative to wild-type (WT) mice at four disease stages. (C) Representative Western blot of HMGB1 with β-tubulin in the lumbar spinal cord of hSOD1G93A (SOD1) mice relative to WT mice at four disease ages. Protein expression of HMGB1 determined by semi-quantitative densitometry in the lumbar spinal cord of hSOD1G93A (SOD1) mice relative to WT mice at four different ages. (D) Representative Western blot of TLR4 with β-tubulin in the lumbar spinal cord of hSOD1G93A (SOD1) mice relative to age-matched WT mice at different ages. Protein expression of TLR4 determined by semi-quantitative densitometry in the lumbar spinal cord of hSOD1G93A (SOD1) mice relative to age-matched WT mice at four different ages. Data expressed as mean ± SEM (n = 9 mice/group (A) and (B); n = 3~4 mice/group (C) and (D); *P < 0.05, **P < 0.01, ***P < 0.001, Student’s t-test). Dashed line represents the baseline expression in WT mice at each disease stage. PS = pre-symptomatic; OS = onset; MS = mid-symptomatic; ES = end-stage; HMGB1 = high-mobility group box 1; mRNA = messenger RNA; TLR4 = toll-like receptor 4.