Figure 7.

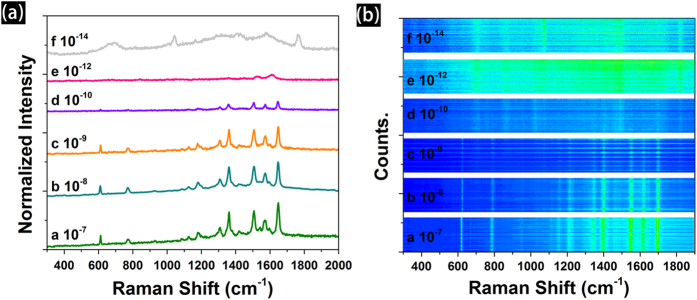
The SERS spectra (a) and reproducibility (b a randomly selected area, more than 120 points) of R6G with different concentration from 1 × 10⁻⁷ to 1 × 10–14 M adsorbed on the screen printed Ag patterns.

The SERS spectra (a) and reproducibility (b a randomly selected area, more than 120 points) of R6G with different concentration from 1 × 10⁻⁷ to 1 × 10–14 M adsorbed on the screen printed Ag patterns.