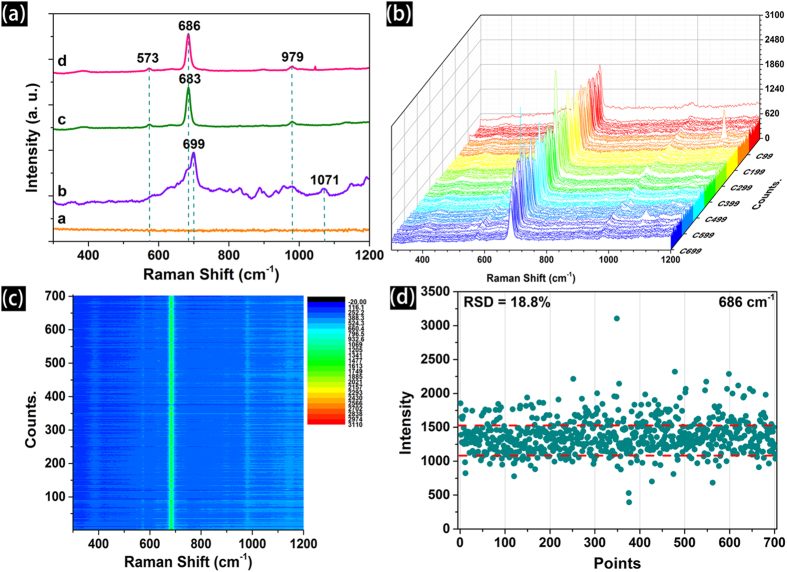
Figure 8.
(a) The SERS performance of screen printed Ag patterns for melamine contaminated fresh milk (curve a: a commercial fresh milk; curve b: pure melamine in ethanol; curve c: 1 × 10⁻² M of MA in milk; curve d: 1 × 10⁻⁴ M of MA in milk); (b) The waterfall plot of SERS spectra (integration time was 2 s, step width is 2 μm); (c) Raman contour plot shows both the intensity and reproducibility of 702 signals (randomly selected an area) from the printed patterns for MA contaminated fresh milk (1 × 10⁻⁴ M); (d) The intensity distributions of the main Raman vibrations of MA (at 686 cm−1) in 702 spots (RSD indicates).

