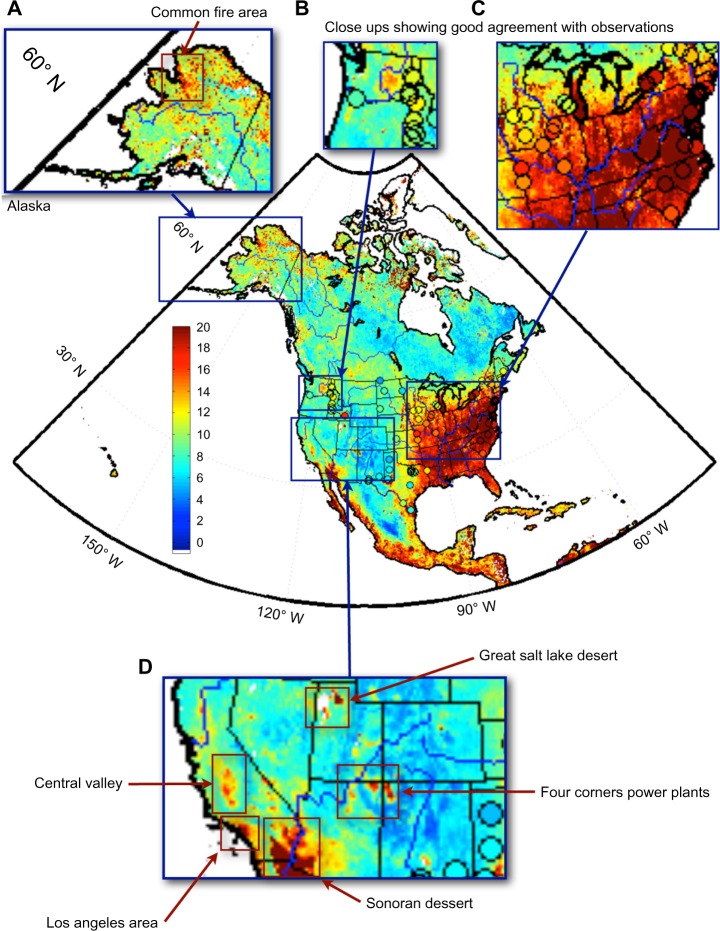
Figure 2.
The monthly average of our machine learning PM2.5 product (μg m−3) for August 2001. The average of the observations at a given site is overlaid as color filled circles when observations were available for at least a third of the days. Notice the good agreement between the PM2.5 product and the observations. Also, as would be expected, in summer, the eastern US has much higher PM2.5 abundance than the western US. Central Valley and LA are clearly visible in California. Inset panel (A) is of Alaska and highlights common fire areas associated with elevated PM2.5. Insets (B) and (C) show the good agreement between our product and observations. Inset (D) shows the elevated PM2.5 with the heavily agricultural Central Valley in California, the highly populated Los Angeles metro area, the Sonoran desert (one of the most active dust source regions in the US), and the Four Corners power plants (some of the largest coal-fired generating stations in the US), and the Great Salt Lake Desert. Note the fine scaled features visible in this product, which are in marked contrast to the AirNow product.

