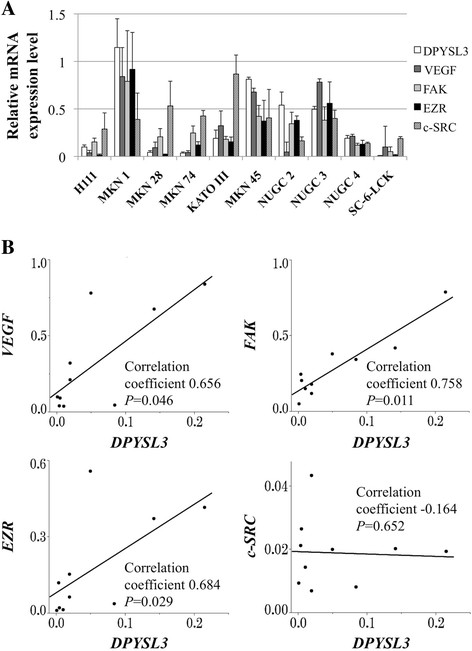
Figure 1.

Expression profile of GC cell lines. (A) Expression status of DPYSL3 and potentially interacting genes in GC cell lines. Differential mRNA expression in GC cell lines was observed. Error bars indicated standard deviation among three biological replicates. (B) Correlative analysis between the mRNA expression levels of DPYSL3 and those of VEGF, FAK, EZR and c-SRC.
