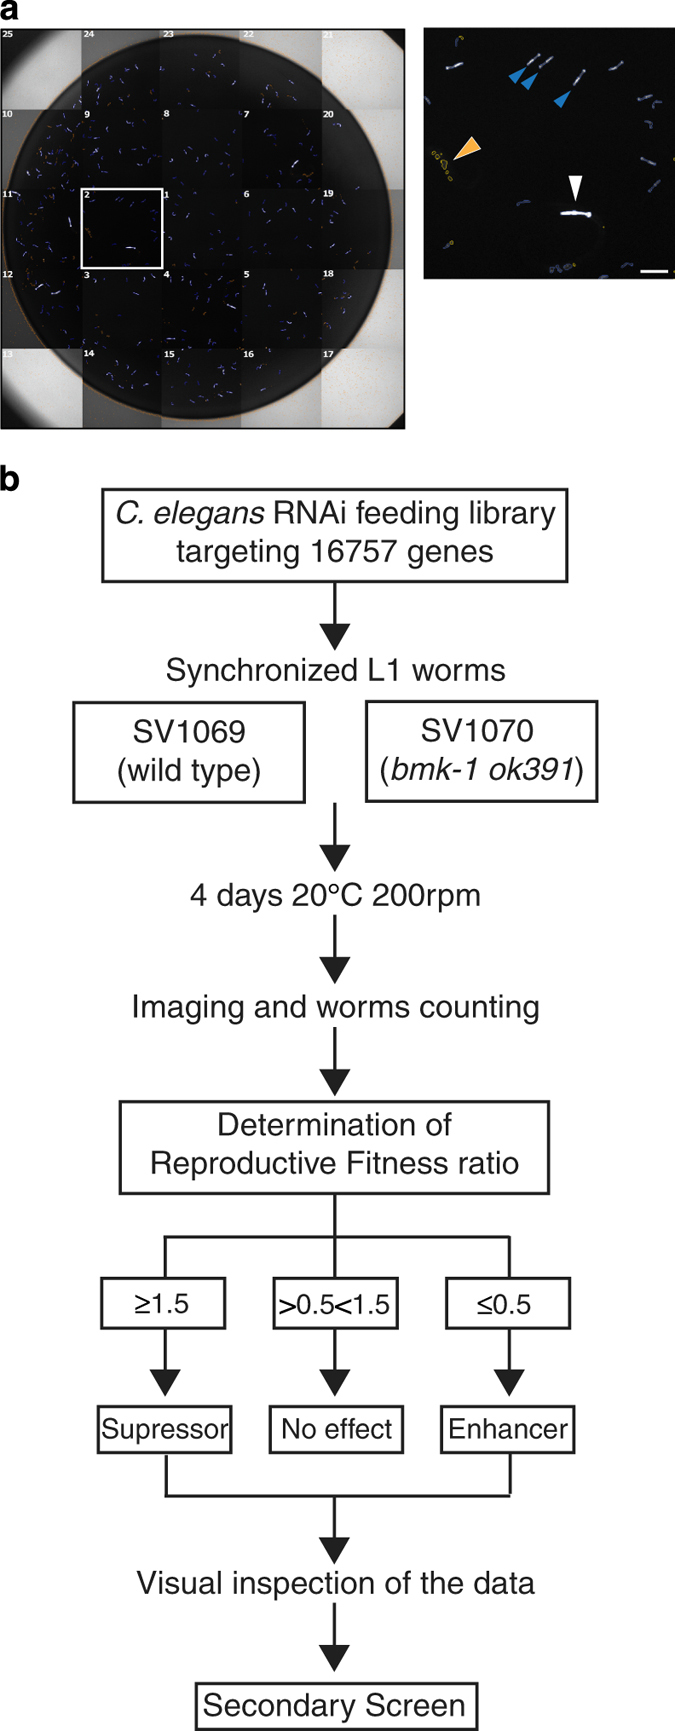
Figure 1. Experimental workflow.

(a) Example of a mosaic reconstruction of an imaged well of the screen. In the magnification of field 2, the white arrowhead shows the pharynx of a parent worm, blue arrowheads show pharynxes of progeny, and the orange arrowhead points to excluded objects. Scale bar is 150 μm. (b) Flowchart of screening protocol. The primary screen was done in two technical replicates. The secondary screen followed the same protocol as the primary screen but used three biological replicates with two technical replicates each.
