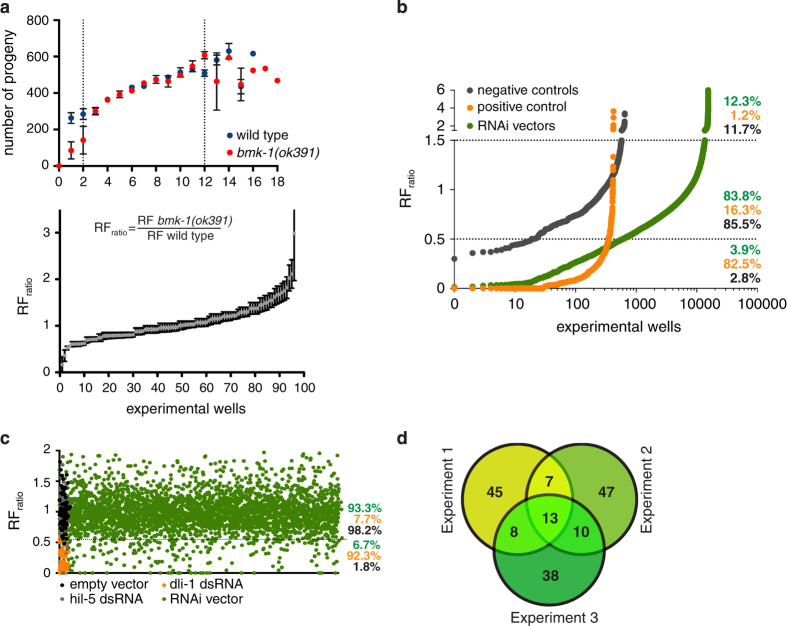
Figure 2. Genome-wide RNAi screen results.
(a, top) Determination of the ideal number of parents per well. Between 2 and 12 the number of obtained progeny is linear. Wild type strain is myo-2::GFP. bmk-1(ok391); myo-2::GFP is the mutant strain. (a, bottom) RFratio calculation and distribution of worms treated with an empty RNAi vector. Error bars represent SEM of three biological replicates, each containing two technical replicates. (b) Primary screen results. RFratio distribution of screen controls and library RNAi vectors. Dashed lines represent the thresholds for the definition of ‘enhancers’ (<0.5) and ‘suppressors’ (>1.5). Percentages represent the total number of negative (grey) and positive (orange) controls within each cut-off range. Total number of library RNAi vectors in each category is also represented by percentages (green). (c) Secondary screen results. RFratio distribution of each control or library RNAi vector across three biological replicates. Dashed line indicates the threshold value below which we considered the RNAi to ‘enhance’ bmk-1(ok391). Percentages represent the total number of negative controls (empty vector, hil-5 dsRNA, in dark grey), positive controls (orange) and library RNAi vectors (green) in each category. (d) Venn diagram showing the common and unique hits found within the biological replicates. 38 targeting sequences classify as ‘enhancers’ in at least two out of the three replicates.

