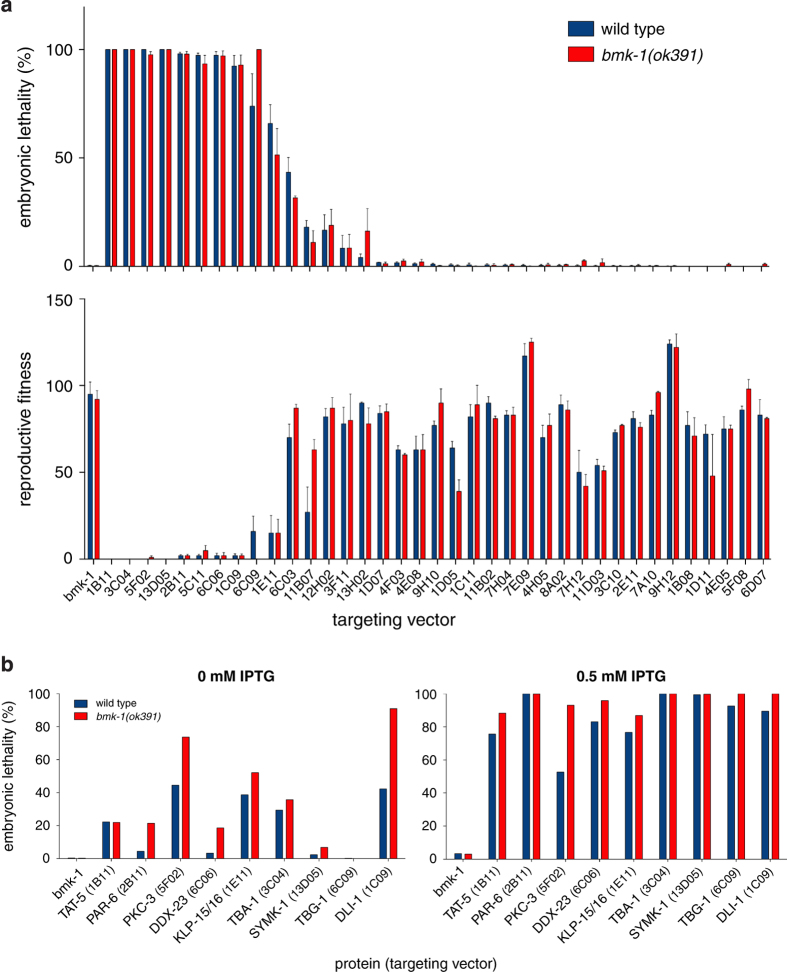
Figure 3. RNAi screen validation.
(a) Embryonic lethality assay with the screen's ‘enhancers’. N2 (blue), wild type strain. SV1005 (red), bmk-1(ok391) deletion strain. RNAi for bmk-1 was used as a negative control. Error bars represent SEM of three technical replicates. Top graph shows embryonic lethality and below the corresponding reproductive fitness (expressed in number of live progeny per parent). (b) Embryonic lethality assay upon weak (0 mM IPTG) or strong (0.5 mM IPTG) depletion of screen ‘enhancers’. Bars represent averages of two technical replicates.

