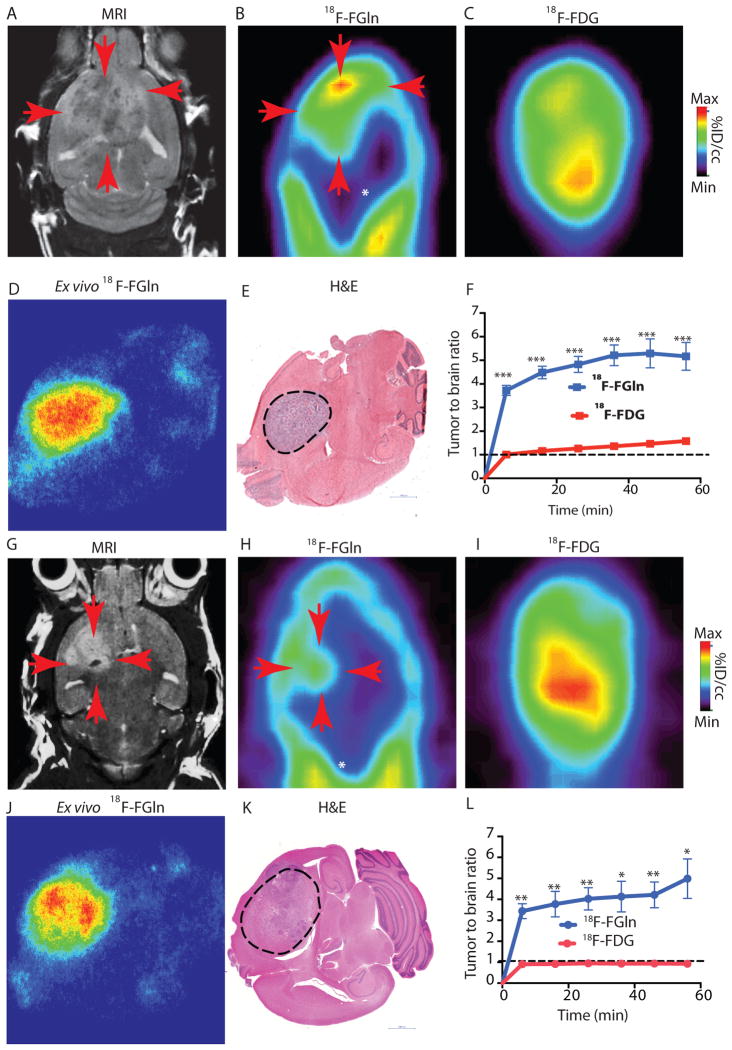
Fig 2. 18F-FGln shows high tumor uptake compared to background in gliomas.
A. Representative coronal MRI depicting tumor (red arrows) in genetically engineered RCAS-PDGF, PTEN −/− mice.
B. Coronal 18F-FGln PET image illustrating high tumor uptake (red arrows) compared to surrounding non-neoplastic brain (white asterisk).
C. Coronal 18F-FDG PET image from the same animal.
D. Representative ex-vivo 18F-FGln autoradiogram from a RCAS-PDGF PTEN −/− animal.
E. Histological section from the same animal depicted in D, showing the tumor region (dotted black line). Scale bars represent 1000 μM.
F. Time activity curve illustrating tumor to background ratio with 18F-FGln (blue) compared to 18F-FDG (red) in RCAS-PDGF PTEN null animals (n=6 each). Dotted black line indicates an equal tumor to brain ratio of 1:1. Statistical significance was determined by two-sided, unpaired, Student’s t-test; *** indicates p < 0.0001.
G. Representative coronal MRI showing tumor (red arrows) in mice orthotopically implanted with TS603 (IDH1 R132H) glioma cells.
H. Coronal 18F-FGln PET image from the same animal illustrating high tumor uptake (red arrows) compared to surrounding non-neoplastic brain (white asterisk).
I. Coronal 18F-FDG PET image from the same animal.
J. Ex-vivo 18F-FGln autoradiogram from the same animal.
K. Histological section from the same animal. Scale bars represent 1000 μM.
L. Time activity curve illustrating tumor to background ratio with 18F-FGln (blue, (n=4 for 36 minute imaging time point, n=3 for all other time points) compared to 18F-FDG (red, n=3 for all time points) in mice orthotopically implanted with TS603 (IDH1 R132H) glioma cells. Dotted black line indicates an equal tumor to brain ratio of 1:1. Statistical significance was determined by two-sided, unpaired, Student’s t-test; * indicates p< 0.05 and ** p<0.01.
For all graphs, data are represented as the means ± s.e.m.

