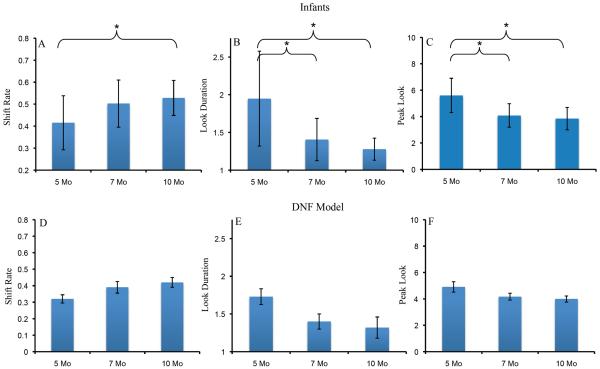
Figure 2.
Panels A–C show developmental changes in shift rate (A), look duration (B), and peak look (C) for infants. Panels D–F show developmental changes in shift rate (D), look duration (E), and peak look (F) for the DNF model. Shift rate is the frequency of gaze shifting relative to total looking time, look duration is the average length of each look, and peak look is the length of the longest look. Error bars show +/− .5 SD.

