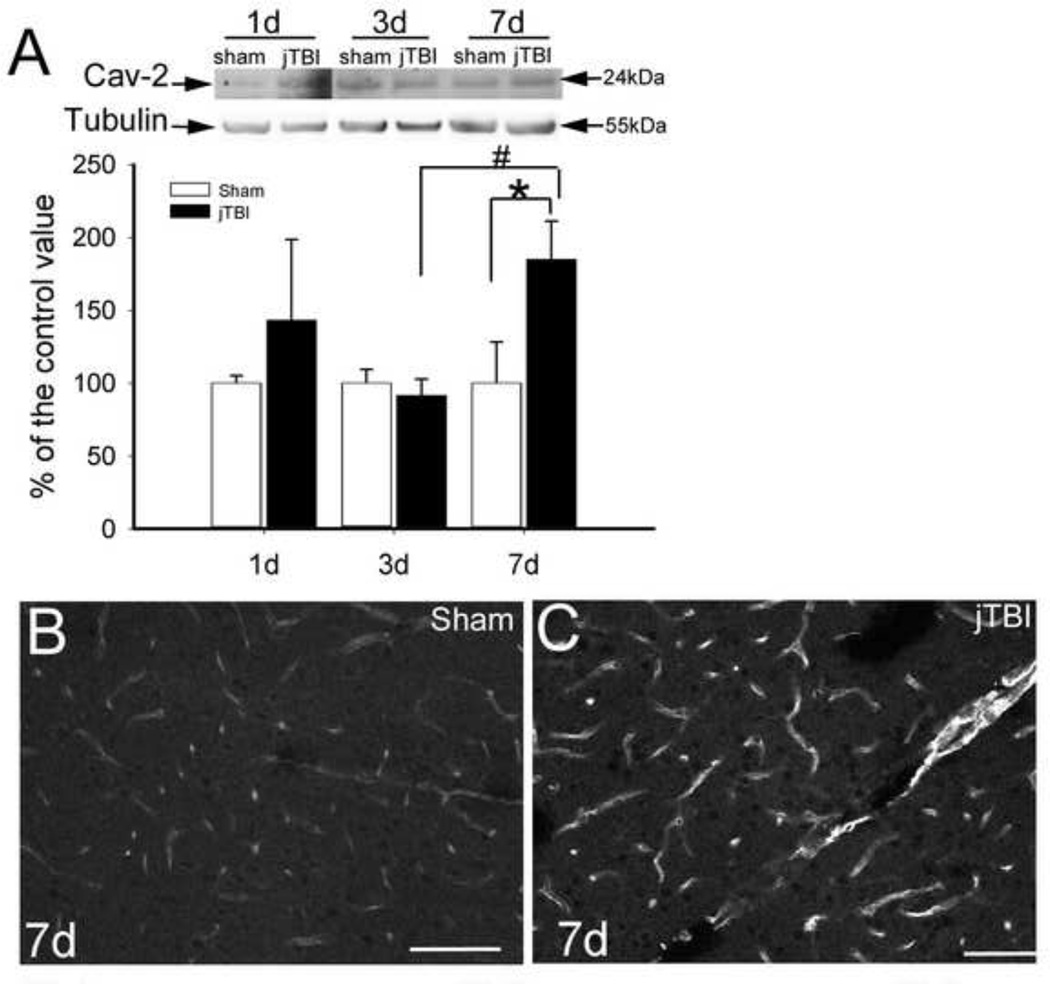
Figure 5. Caveolin 2 Expression expression after jTBI.
(A) Western blot of cav-2 showed a band around 20kDa with a significant increase in intensity between sham and jTBI group at 7d post-injury (*p<0.05). In jTBI group, cav-2 is significantly increase between 3 and 7d (#, p<0.05)
(B, C) Cav-2 staining in the sham (C) and jTBI (D) at 7d exhibits higher intensity of staining in cortical blood vessels of the jTBI group than in sham
B, C, bar = 100µm

