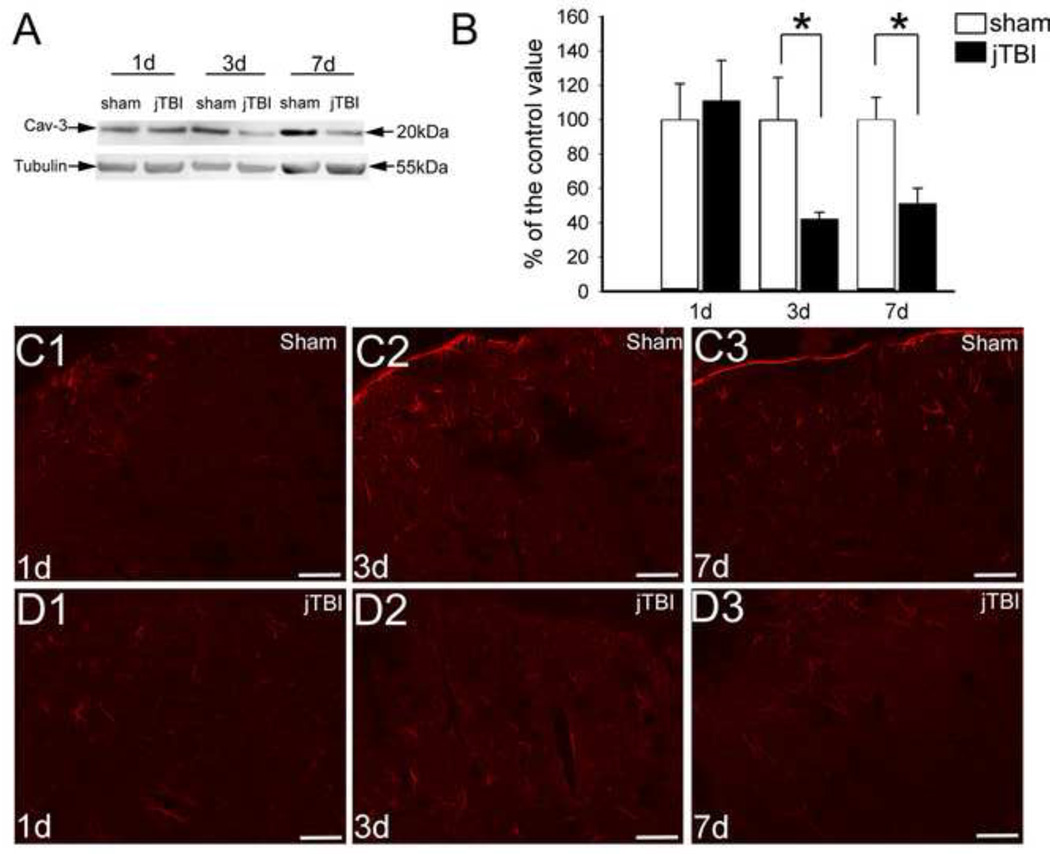
Figure 6. Caveolin-3 Expression and Distribution after jTBI.
(A) Western blot of cav-3 (red) showed a band around 20kDa and is significantly decreased in jTBI compared to sham at 3 and 7d.
(B) The quantification of the intensity of the band for cav-3 was normalized to the tubulin (55kDa).
(C, D) Cav-3 staining in the sham (C) and jTBI (D) at 1d (C1, D1), 3d (C2, D2) and 7d (C3, D3). In accordance with the western blot, no major changes were observed in cav-3 staining at 1d (C1, D1). However, the pattern of cav-3 staining differs between the jTBI and sham animals at 3d (C2, D2) and 7d (C3, D3). In the glia limitans, cav-3 staining is decreased in jTBI animals (D2, D3) compared to sham (C2, C3). The intensity of cav-3 staining is decreased in jTBI animals (D2, D3) compared to sham (D2, D3) despite an increase of the extend of the surface staining for cav-3 in jTBI group at both time points.
C, D, bar = 100µm

