
Figure 2.
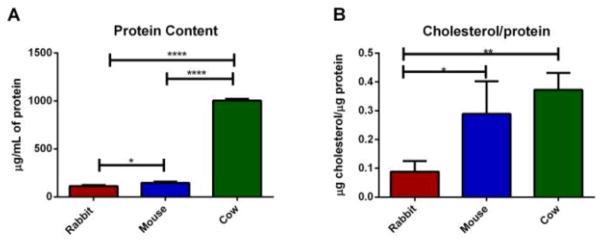
(A) Total % protein content for the same number of platelets compared to the total protein content of mouse platelets. (B) % ratio of the amount of cholesterol to the total protein content of platelets from each species compared to the mouse cholesterol ratio. Error bars are SD. For significance one way ANOVA was used * for p<0.05, ** for p<0.015, **** for p<0.0001