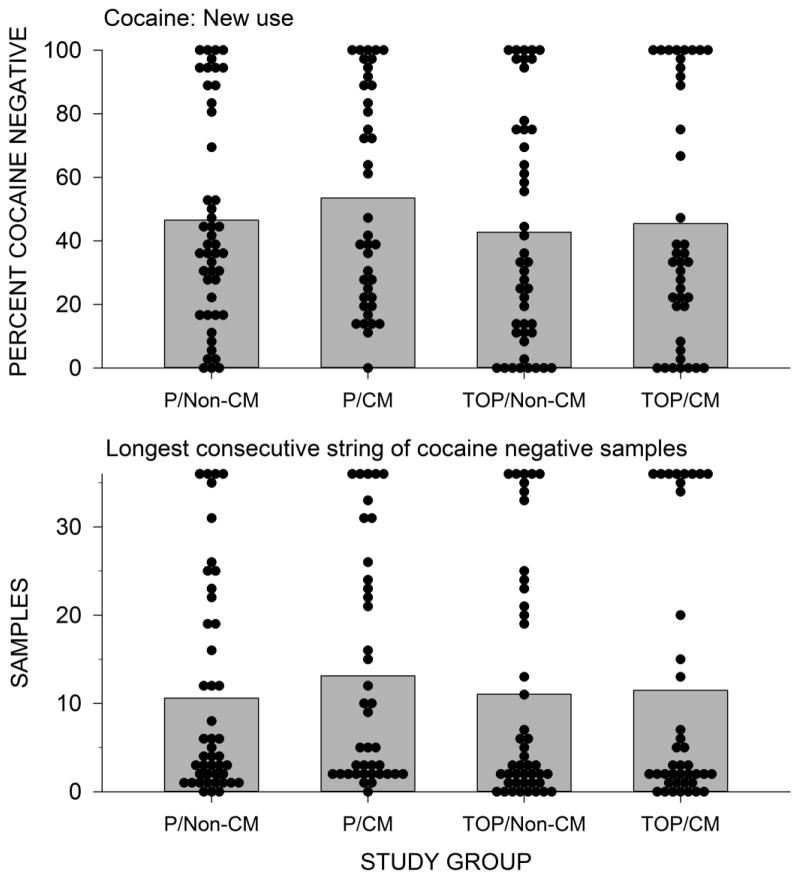
Figure 4.
Upper panel: Percent cocaine negative urine samples per participant by treatment groups (modified Preston rule). Dots represent the percentage of cocaine negative urine samples for individual participants. The bars represent the mean proportion of cocaine negative urine samples for the group. Lower panel: Longest duration of cocaine abstinence by treatment groups as shown by the number of consecutive cocaine negative urine samples

