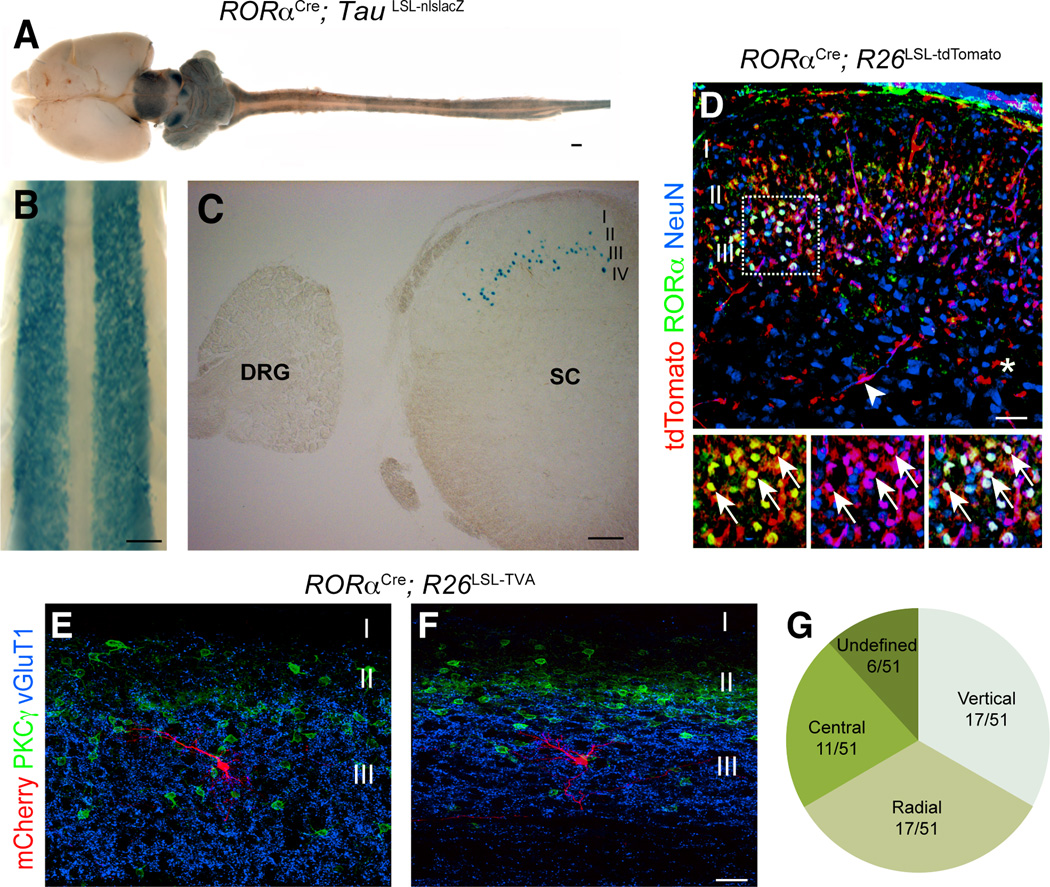
Figure 1. Characterization of RORαCre-derived INs in the spinal cord.
(A–C) Images from P10 RORαCre; TauLSL-nlslacZ mice showing β-galactosidase expression in the central nervous system (A) and spinal cord (B and C). C shows transverse section through the spinal cord. (D) Section through P10 RORαCre; R26LSL-tdTomato lumbar spinal cord stained with antibodies to RORα (green) and NeuN (blue). tdTomato+ fluorescence (red) was visualized without staining. Merged image shows tdTomato is largely restricted to RORα+/NeuN+ neurons in lamina IIi/III. The tdTomato+ cells located outside of lamina II/III do not express NeuN. Arrows indicate double-labeled neurons. Arrowhead in D indicates a tdTomato+ blood vessel. Asterisk marks a tdTomato+ glial cell. (E–F) mCherry-labeled neurons (red) in the lumbar cord of P21 RORαCre; R26LSL-TVA mice. Their location in relation to excitatory PKCγ+ neurons (green) and vGluT1 sensory afferents (blue) is shown. (G) Summary of the morphological profile of 51 RORα INs. Scale bars: 1000 µm (A), 500 µm (B), 200 µm (C), 100 µm (D), 25 µm (E and F). See also Figure S1.

