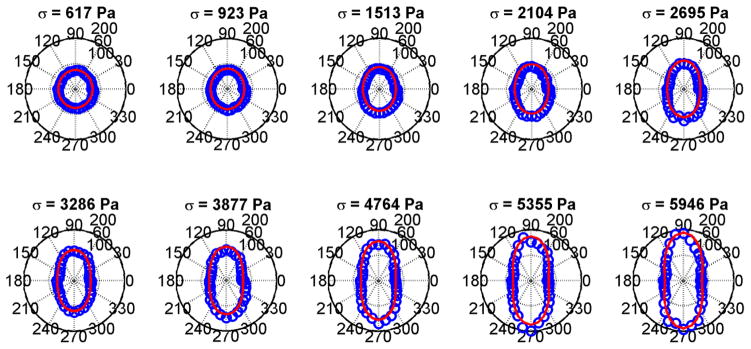
Fig. 8.

Polar plots of mean shear moduli (blue circles) and fit (red line) to the TI model from Eq. (3) for the phantom with 10.00% gelatin concentration. (a) σ = 617 Pa, (b) σ = 923 Pa, (c) σ = 1513 Pa, (d) σ = 2104 Pa, (e) σ = 2695 Pa, (f) σ = 3286 Pa, (g) σ = 3877 Pa, (h) σ = 4764 Pa, (i) σ = 5355 Pa, (j) σ = 5946 Pa.
