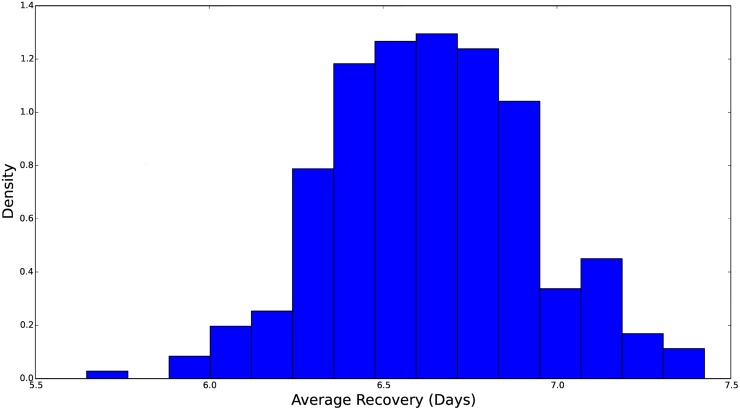
Fig 7. Histogram of the marginal distribution for the average recovery time, measured in days.
The rate parameter in our S ν EIR model, γ, is the inverse of this average time. We see that this distribution is concentrated over 6–7 days and skewed toward longer incubation times. The prior distribution for γ is more concentrated than the distributions for θ and β 0 which means that the ILI data determine this parameter more exactly.

