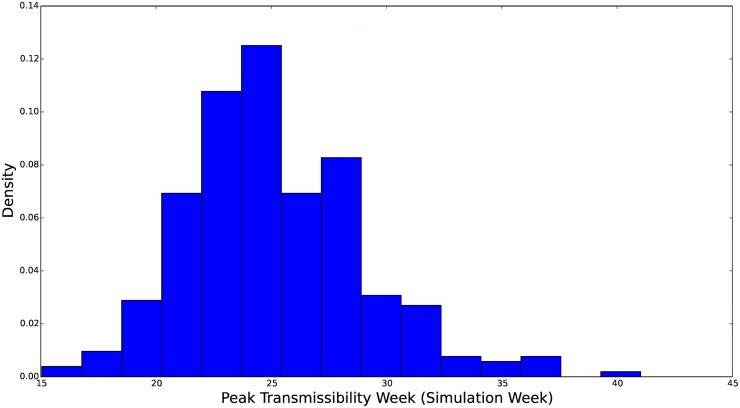
Fig 8. Histogram of the marginal distribution for the peak of the transmissibility function, β(t;β 0, α, c, w).
The parameter c here is represented in weeks since the beginning of simulation. Thus, a value c = 16 corresponds to the peak transmissibility during the 48th epidemiological week. We see that this distribution is concentrated over 20–30 weeks into the simulation and skewed toward late in the simulation.

