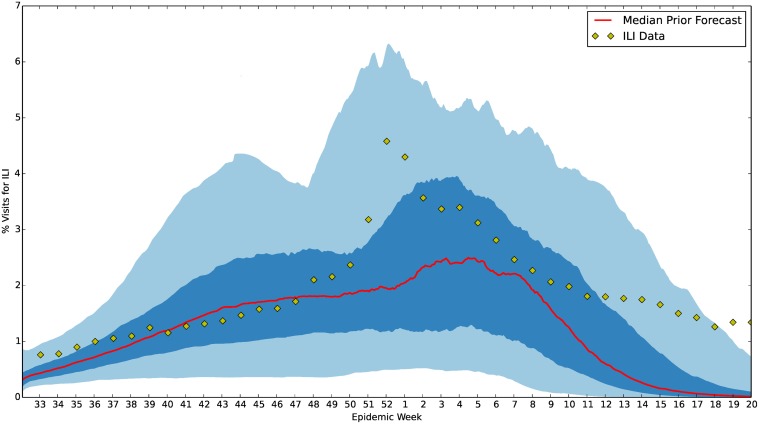
Fig 10. U.S. ILI prior forecast for 2013–2014 flu season.
This figure shows the prior forecast along with the 2013–2014 ILI data. Note the potential for an early and late peaking influenza season. The red line represents the median forecast from 300 samples of the prior. The dark blue and light blue regions represent the 50% and 90% credible regions centered around this median, respectively. Credible intervals were also generated from 300 samples of the prior.

