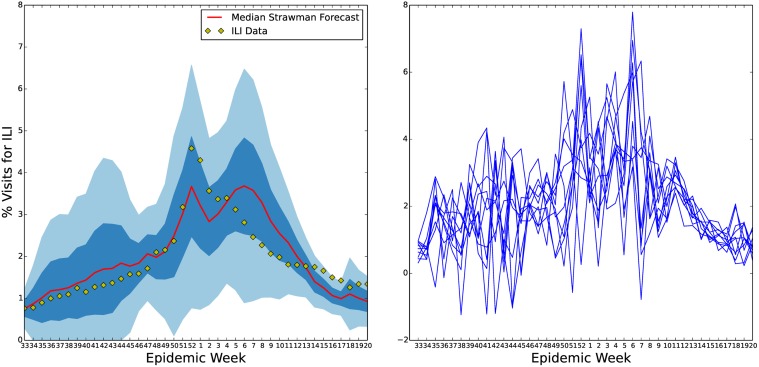
Fig 12. U.S. ILI straw man forecast.
This figure shows the results of our straw man prediction based on averaging past flu seasons. Since this forecast of the 2013–2014 influenza season was made using only the statistics of the sample mean and sample standard deviation from previous season’s ILI observations it’s credible intervals (left) do a good job of containing the current influenza season. This forecast does not include any causal model of influenza spread. There is, therefore, no correlation between the forecast at successive time points. This is seen when sampling time series from this forecast (right). The lack of correlation in forecasts for successive weeks severely limits the usefulness of such a forecast for public health decision making. For instance, after the 2013–2014 ILI peak was observed a further ILI peak is forecast to be just as likely six weeks later.

