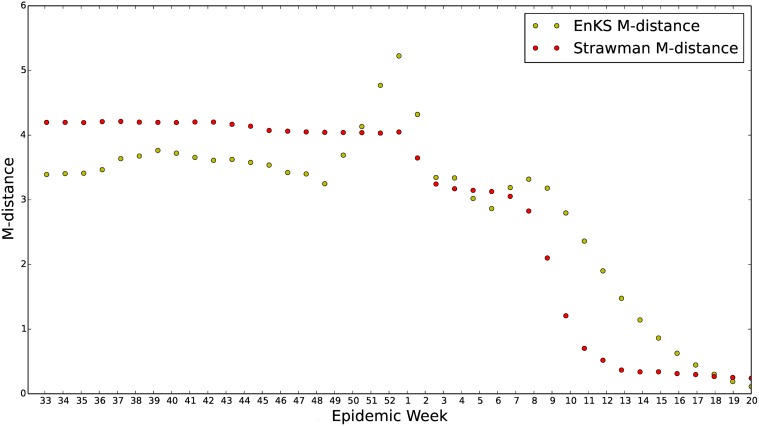
Fig 13. S ν EIR with enKS vs. straw man forecast for the 2013–2014 U.S. ILI data.
The M-distance between U.S. 2013–2014 ILI data and the two forecasts is plotted. The M-distance between the forecast and ILI data is calculated for each epidemiological week until the end of the influenza season. The M-distances at week 36 uses the forecast observations from week 36 of 2013 to week 20 of 2014 and the ILI data from week 36 of 2013 to week 20 of 2014. The M-distances plotted for the straw man prediction use sample covariances and means calculated from 300 time series draws of the straw man forecast. Due to the lack of causal relations included in the straw man model this measure of accuracy is significantly lower in the early season for the straw man prediction. This figure shows that the data assimilation forecast has a noticeably smaller M-distance, and therefore is quantitatively better, than the straw man model for the early influenza season. Once the influenza season peaks the success of the forecast breaks down due to model error. It is interesting to note that due to the enKS data assimilation our S ν EIR forecast seems to attempt self-correction, i.e. the M-distance is increasing and then decreases.

