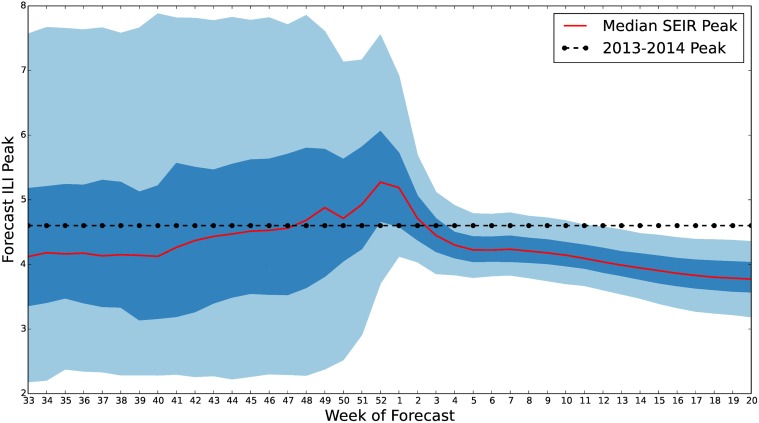
Fig 17. S ν EIR peak quantiles for 2013–2014 U.S. ILI.
50% and 90% credible interval estimates of the influenza season peak are plotted along with the median. Forecasts for the size of the ILI peak were widely varying in the 90% credible interval. This could possibly be reduced by the elimination of high peak outliers such as the 2009 H1N1 emergence and through adjustment of low forecasts in our prior. However, even with these draw backs the 50% credible region has a width of only 1%–2%.

