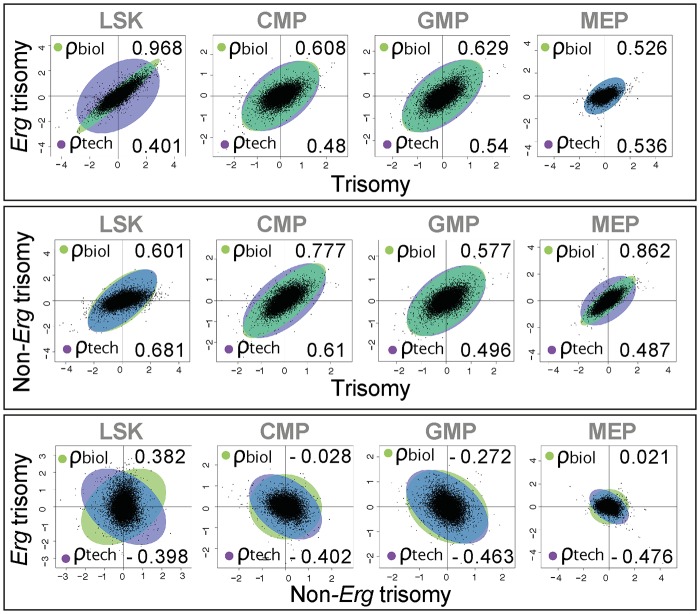
Fig 3. Biological correlation of gene expression changes using gene association analysis.
Scatter plots by log2 fold gene expression changes in LSK, CMP, GMP and MEP cells comparing: top panel, changes due to full trisomy (Ts65Dn/Erg +/+/+ versus Erg +/+) with those specific for trisomy of Erg (Ts65Dn/Erg +/+/+ vs Ts65Dn/Erg +/+/Mld2); middle panel, expression changes due to full trisomy with those attributable to non-Erg genes in trisomy (Ts65Dn/Erg +/+/Mld2 versus Erg +/+); and lower panel changes attributable to Erg trisomy with those non-Erg genes in trisomy. Green ellipses indicate the strength of biological correlation (ρbiol) and blue ellipses show technical correlation (ρtech) as estimated by GENAS.

