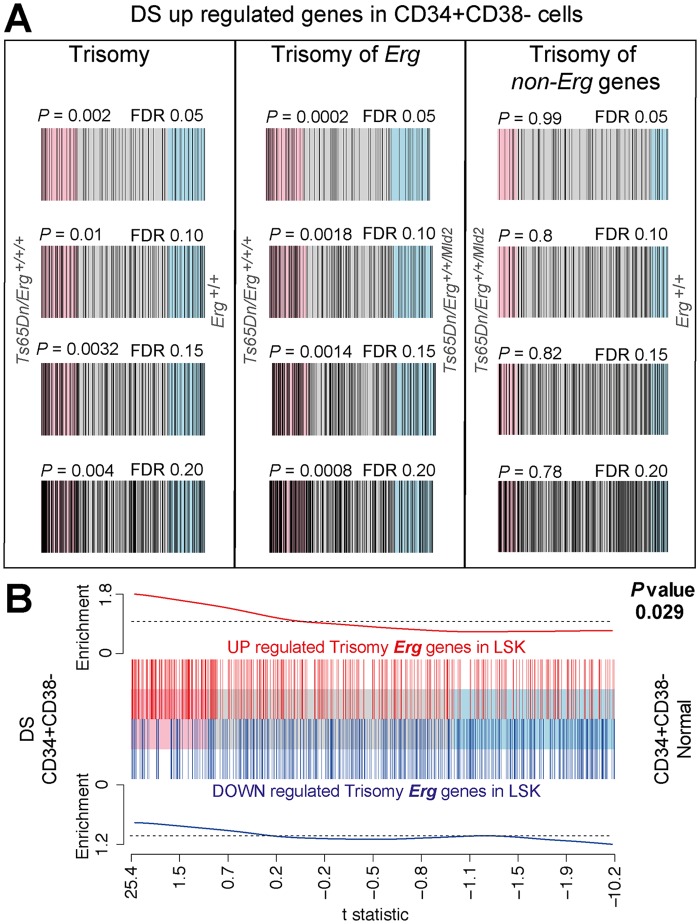
Fig 5. Human DS Lin-CD34+CD38- HSPC gene expression changes correlate with changes due to trisomy of Erg in Ts(1716)65Dn LSK cells.
A. Barcode plots of upregulated genes in human DS Lin-CD34+CD38- stem and progenitor cells (HSPC) relative to diploid HSPCs using a FDR of 0.05, 0.10, 0.15 and 0.20 (see S5 Table) compared to gene expression changes in Ts(1716)65Dn LSK cells due to full trisomy defined by the comparison of gene expression in Ts65Dn/Erg +/+/+ versus Erg +/+ cells, (left panels), changes attributable specifically to Erg trisomy (Ts65Dn/Erg +/+/+ versus Ts65Dn/Erg +/+/Mld2, middle panels), and those due to trisomy of non-Erg genes (Ts65Dn/Erg +/+/Mld2 versus Erg +/+, right panels). Human DS HSPC genes (black bars) are upregulated in Ts(1716)65Dn LSK gene expression changes attributable specifically to trisomy of Erg (middle panels) but not due to trisomy of non-Erg genes (right panels). Rotation gene set test ROAST P-values shown. B. Barcode plot showing correlation between gene expression changes in Ts(1716)65Dn LSK cells due to Erg trisomy (from comparison of Ts65Dn/Erg +/+/+ versus Ts65Dn/Erg +/+/Mld2) with gene expression changes in human DS HSPCs relative to diploid cells. Horizontal axis shows moderated t-statistic values for the human DS HSPC versus diploid HSPCs comparison. Red bars show upregulated genes and blue bars downregulated genes resulting specifically from Erg trisomy in Ts(1716)65Dn LSK cells (FDR < 0.05, S2 Table). Red and blue worms show relative enrichment of up and downregulated genes respectively (ROAST P-value = 0.029 for upregulated genes).

