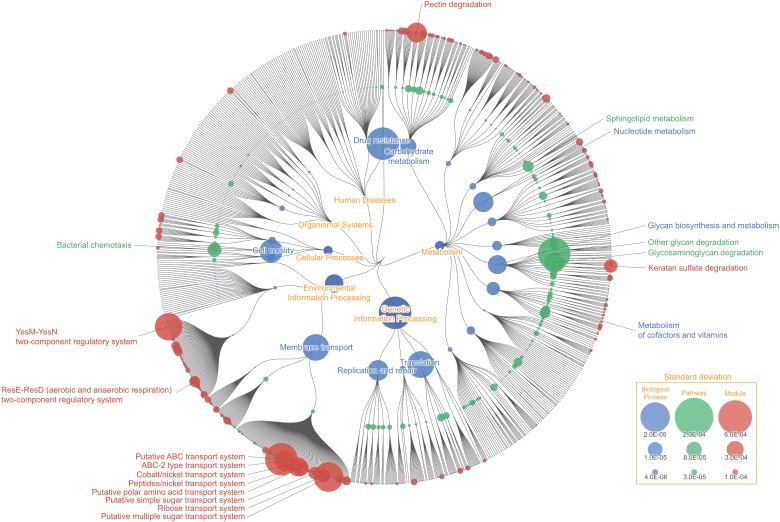
Fig 4. Functional variability of human gut microbiota.
Color node represents biological functions that were highly variant among fecal samples from different individuals. Node size corresponds to the value of standard deviation of the KO’s relative abundance assigned to that function. “Other glycan degradation (map00511)”, “Glycosaminoglycan degradation (map00531)”, and “Bacterial chemotaxis (map02030)” showed high variability among the KEGG Pathway layer, while “Pectin degradation (M00081)”, "Peptides/nickel transport system (M00239)", "Ribose transport system (M00212)", and "ABC-2 type transport system (M00254)" showed high variability among the KEGG Module layer. The difference in variability pattern between the KEGG Pathway layer and KEGG Module layer in this mapping illustrate the potential problem of focusing on a particular functional category, and shows the necessity for overviewing the broad functional potential across different functional layers.

