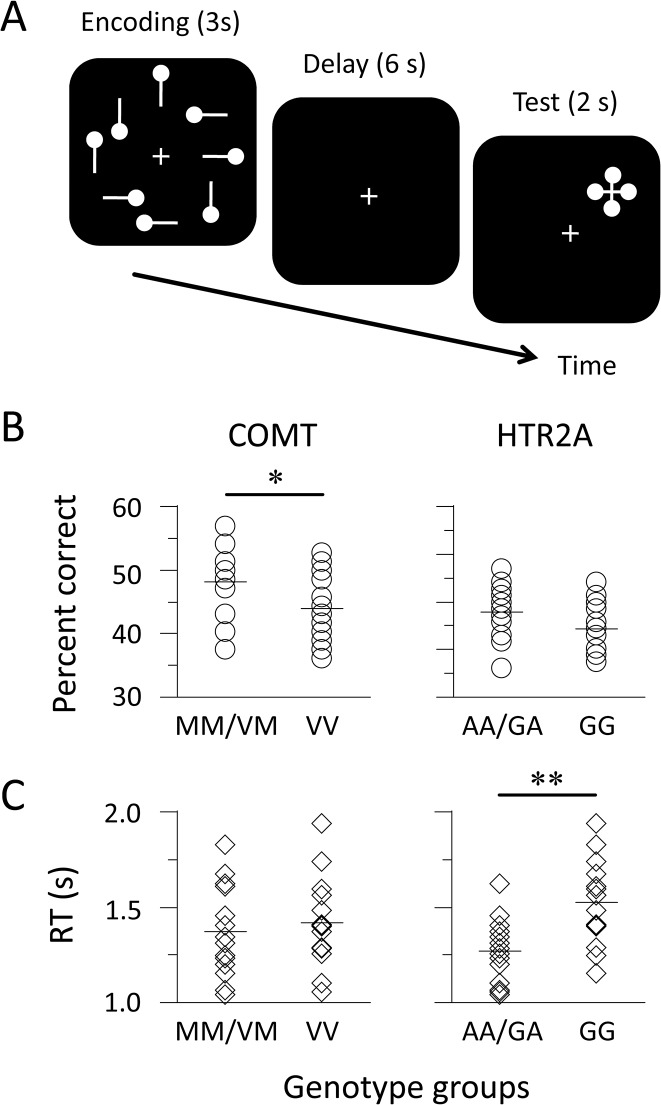
Fig 1. Schematic representation of stimuli and task performance.
(A) Participants memorized a sample display during the encoding phase and retained the configuration of circles during the delay phase. When a probe appeared during the test phase, they indicated the position of the target circle from four possible positions by pressing a button. (B and C) Circles and diamonds indicate the percentage of correct responses and the median of response times (RTs) for each individual, respectively. Horizontal bars represent the mean of the genotype groups. ** p < 0.01, * p < 0.05, N = 14 for each group.

