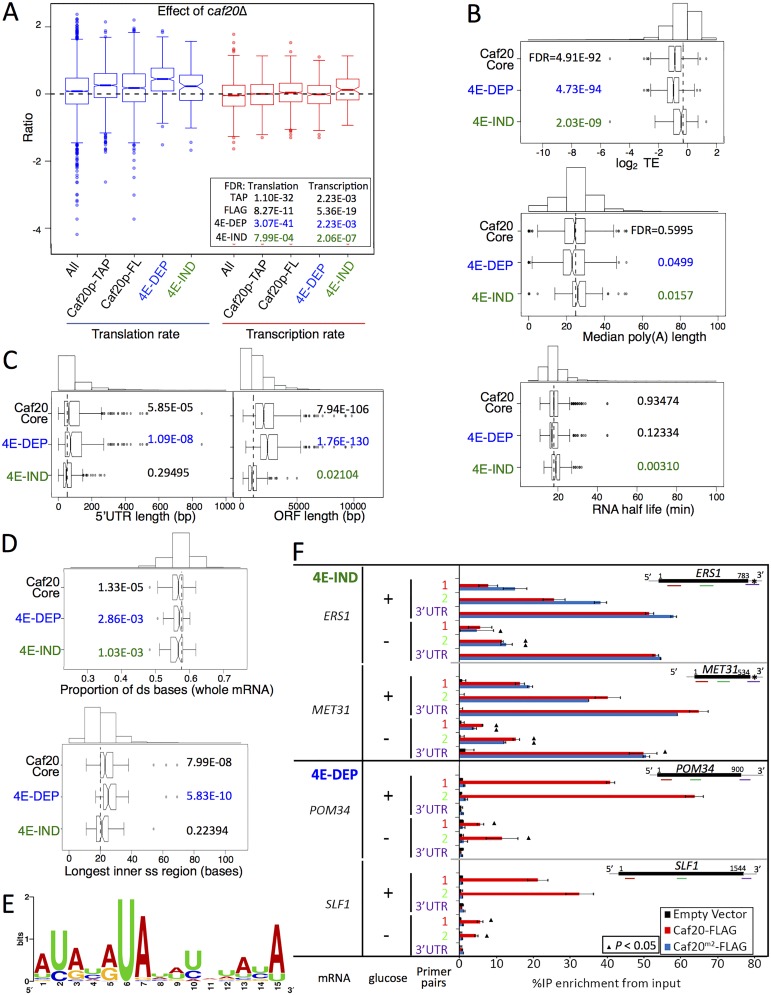
Fig 6. Features of Caf20p 4E-DEP and 4E-IND core bound mRNAs.
A. Box and whisker plot showing impact of caf20Δ on polysome association (blue) and transcript abundance (red) across sets of Caf20p-associated mRNAs [19]. A 95% confidence interval around the median is represented by a notch. Where notches do not overlap the medians are different. Inset: P values represent FDR (Mann-Whitney U tests) versus non-target RNAs. B-D: Box and whisker plots comparing mRNA features of Caf20 core mRNA targets and the 4E-DEP and 4E-IND subgroups. Histograms above each plot show binned total data with the vertical dashed line indicating the median of the total. P values represent FDR (Mann-Whitney U tests corrected for multiple hypothesis testing). Gene sets were statistically tested versus the set of mRNAs not bound to TAP or FLAG tagged Caf20p. B. Translation efficiency (TE) data was taken from ribosome footprinting experiments, median poly A tail length [37] and mRNA half-life [38]. C. 5’ UTR and ORF lengths and D. secondary structure information [40] are similarly shown. E. Sequence motif identified in 3’UTRs of 4E-IND mRNAs using the MEME Suite [43]. See S1 Dataset, sheet 11 for individual motifs identified. F. Caf20p interactions with 4E-IND mRNA 3’UTRs and with ORFs differ in sensitivity to glucose starvation. Fraction of each indicated RNA (left) isolated in complex with Caf20-FLAG (red) or Caf20m2-FLAG (blue bars) or an empty vector control (black bars) from caf20Δ cells following formaldehyde cross-linking and RNase III digestion. qRT-PCR detection with primer pairs hybridizing along each RNA as indicated by colour coding in each cartoon (right). Samples were prepared from cells grown in SCD (+ glucose) or following 10 min of glucose starvation (- glucose). Statistically significant changes ± glucose indicated by ▲ (T-test).

