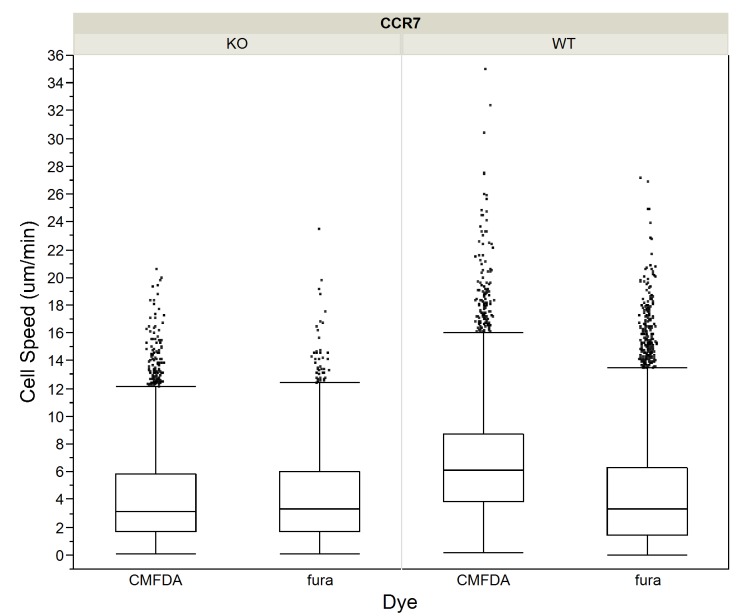
Fig 5. Cell speeds in WT and CCR7-/- T cell motility in mouse lymph nodes, by cell type and dye.
Box-plots showing step-based cell speeds calculated from 2P microscopic observation of CCR7-/- (KO) and wild-type (WT) T cells broken out by cell type and the two dyes used to image them, CMFDA and fura.

