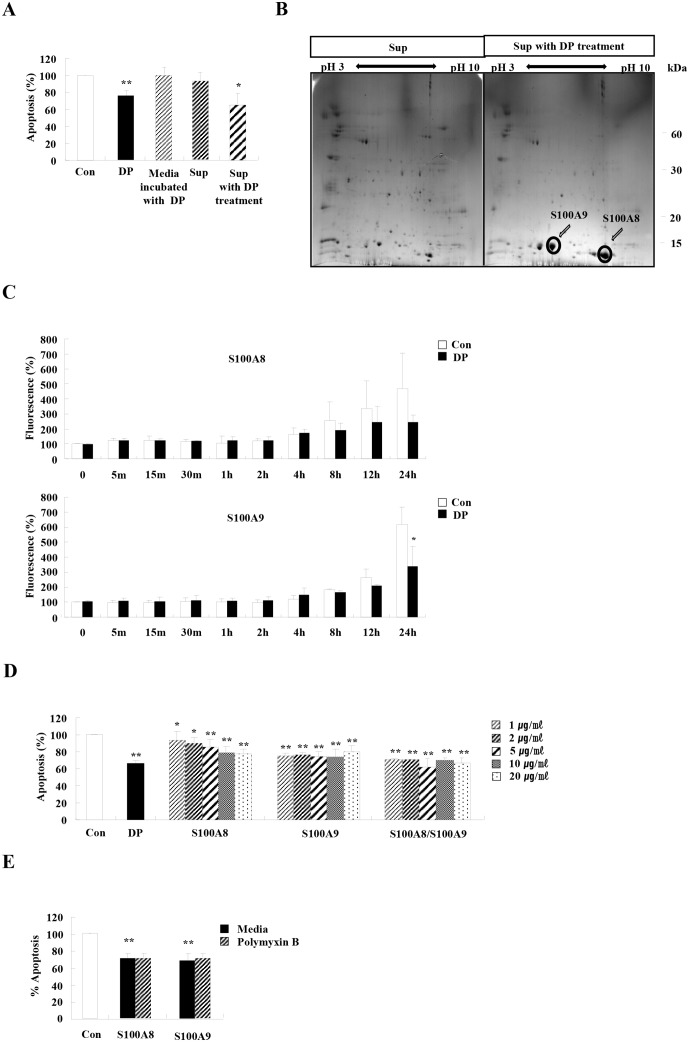
Fig 3. Both S100A8 and S100A9 are released after DP treatment and suppress neutrophil apoptosis.
(A) Neutrophils were incubated with and without 10 μg/ml of DP for 24 h. The supernatant (Sup) was collected and added to the fresh neutrophils obtained from the peripheral blood of normal individuals (n = 9). Media were incubated with DP for 24 h in a 5% CO2 incubator at 37°C. The media were collected and added to the fresh neutrophils obtained from the peripheral blood of normal individuals (n = 5). Apoptosis was analyzed by measuring the binding of annexin V-FITC and PI. Data are expressed as the means ± SD and are presented relative to the control, which was set at 100%. **p < 0.01 indicates a significant difference between the control and the DP-treated group, and *p < 0.05 represents a significant difference between the control group and the Sup with DP treatment-treated group. (B) Neutrophils were incubated with and without 10 μg/ml of DP for 24 h. The supernatant (Sup) was collected and analyzed by 2DE and MALDI-TOF/TOF. (C) Neutrophils (n = 3) were incubated with 10 μg/ml of DP for the indicated time. The cells were fixed and permeabilized with 0.37% paraformaldehyde solution and 0.2% Triton X-100 solution, respectively, then incubated with anti-S100A8 or anti-S100A9 antibodies and analyzed on a FACSort cytofluorimeter. The mean intensity of untreated cells was considered 100%. Alteration of intracellular S100A8 and S100A9 expression after DP treatment was evaluated as the mean intensity of DP-treated cells/the mean intensity of untreated cells × 100. (D) Neutrophils (3<n<6) were incubated for 24 h in the absence (Con) and presence of S100A8 and S100A9 (10 μg/mL) in the indicated concentration. (E) Normal neutrophils (n = 4) were pre-treated for 1 h with and without 50 μg/ml polymyxin B after which the cells were incubated for 24 h in the absence and presence of S100A8 or S100A9DP (10 μg/ml). Apoptosis was analyzed by measuring the binding of annexin V-FITC and PI. Data are expressed as the means ± SD and are presented relative to the control, which was set at 100%. *p < 0.05 and **p < 0.01 indicate a significant difference between the control and stimulator-treated groups.

