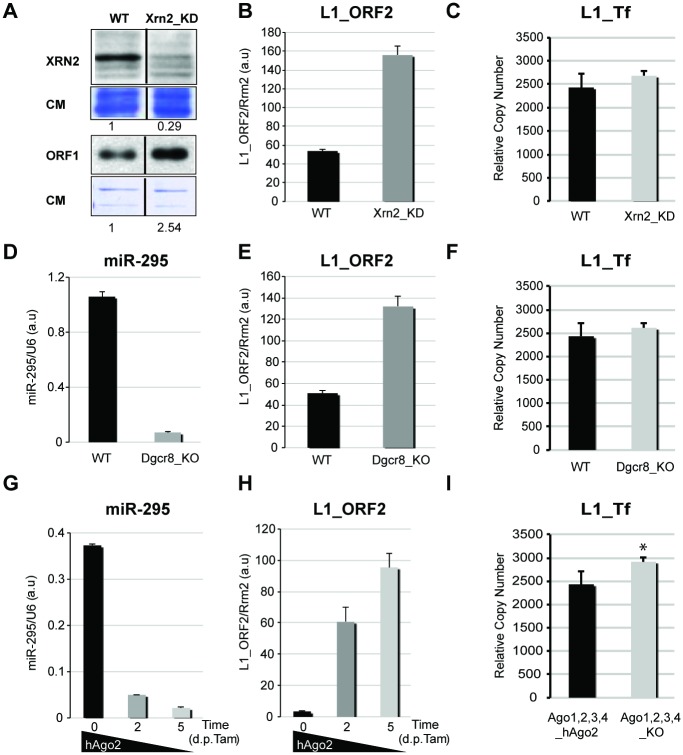
Fig 4. L1 mRNA levels and genomic copy-number in various knock-out and knock-down mESC lines.
A. Western analysis of XRN2 and L1_ORF1 accumulation in WT and Xrn2_KD mESCs; CM: Coomassie staining of total protein. B. qRT-PCR analysis of L1_ORF2 mRNA levels in WT and Xrn2_KD mESCs. C. qPCR analysis of L1_Tf copy-number in WT and Xrn2_KD mESCs. D–E. qRT-PCR analysis of miR-295 (D) and L1_ORF2 mRNA (E) levels in WT and Dgcr8_KO mESCs. F. qPCR analysis of L1_Tf copy-number in WT and Dgcr8_KO mESCs. G–H. qRT-PCR analysis of miR-295 (G) and L1_ORF2 mRNA (H) levels upon hAgo2 deletion in Tamoxifen-treated Ago1,2,3,4_KO mESCs. I. qPCR analysis of L1_Tf copy-number in Ago1,2,3,4_KO_hAgo2 mESCs before and after hAgo2 deletion. *: p-value<0.1.

