
Fig 5. Validation of gene expression in the calcium signaling pathway.
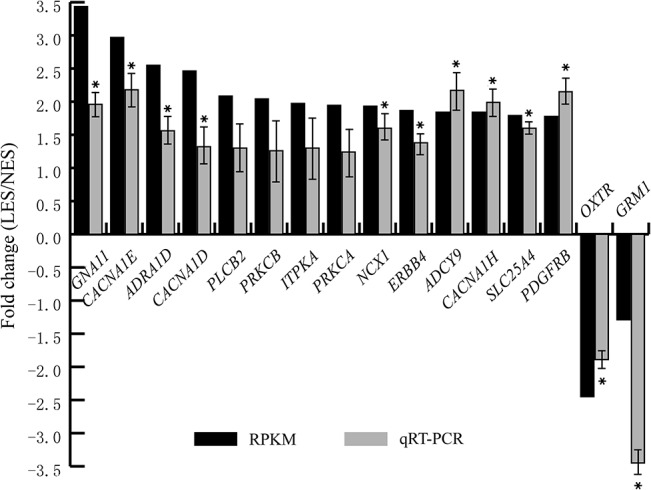
The qPCR was performed to quantify gene expression level. The 2−ΔΔCT method was used analyze changes in gene expression relative to chicken β-actin. Fold changes between the low eggshell strength (LES) group and the normal eggshell strength (NES) group were calculated for each gene. * represent the significant differentially expressed genes by the qPCR (P < 0.05, one way ANOVA analysis). Fold-changes based on RNA-Seq and qPCR were highly correlated (r = 0.71).