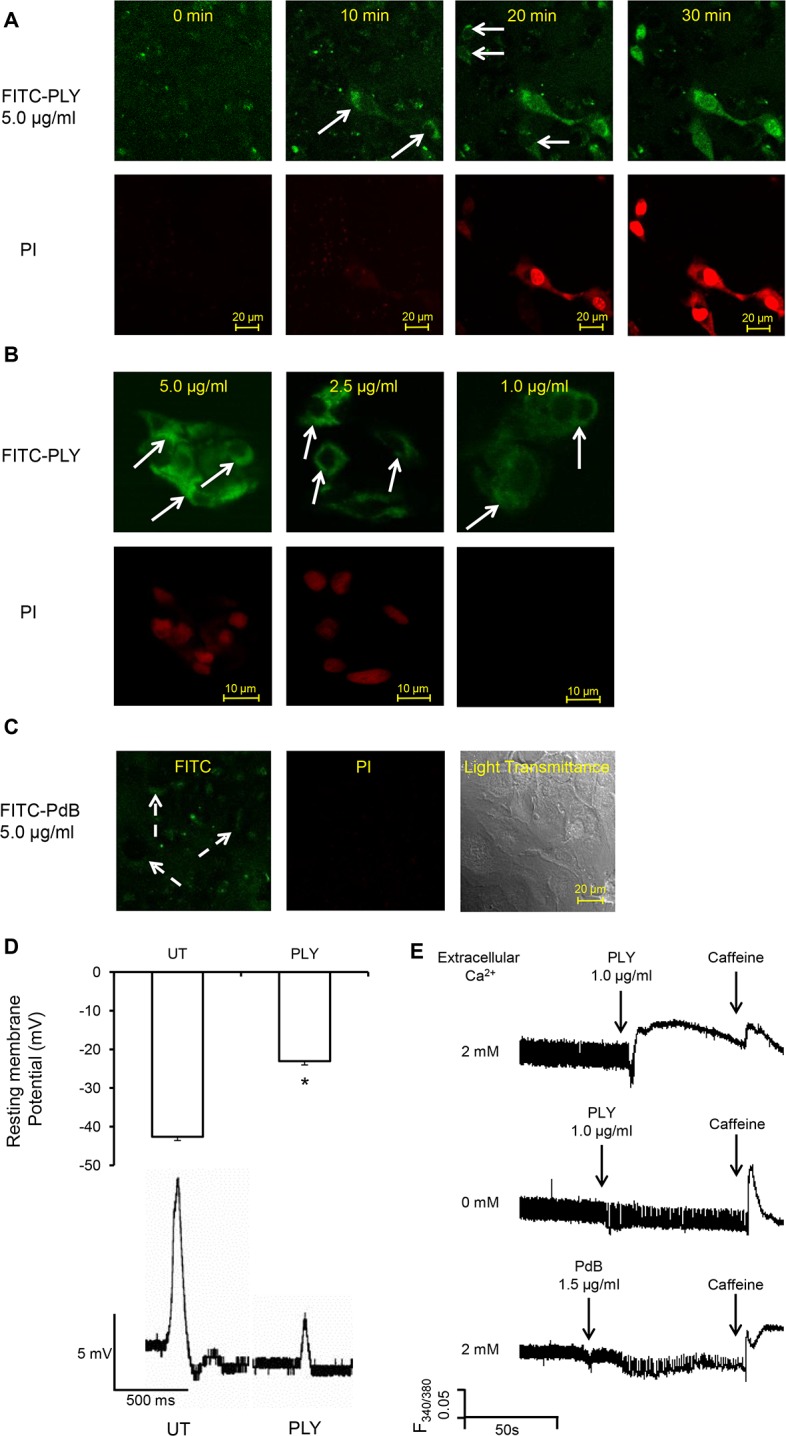
Fig 5. PLY binds to cardiomyocyte membrane and disrupts Ca2+ homeostasis and membrane potential at sub-lytic concentrations.

(A) HL-1 cells were incubated with 5 μg/ml FITC-PLY and 1.0 μg/ml propidium iodide (PI) to monitor disruption of membrane integrity over time. The localisation of FITC-PLY (green) and PI (red) were recorded using time lapse confocal microscopy (LSM 710, Zeiss) in a maintained environment of 5% CO2 at 37°C. Arrows indicate membrane binding of FITC-PLY. Bar = 20 μm (n = 3). (B) HL-1 cells were treated with 5, 2.5, or 1 μg/ml FITC-PLY along with 1.0 μg/ml PI for 30 min. Following washing in PBS and fixation in 4% PFA, localisation of FITC-PLY and PI were visualized under the same conditions for comparison. Typical images of each dose are presented (n = 3). Arrows indicate membrane binding of FITC-PLY. Bar = 10 μm. (C) HL-1 cells were incubated with 5 μg/ml FITC-PdB and 1.0 μg/ml propidium iodide (PI) to monitor disruption of membrane integrity over time. The localisation of FITC-PdB (green) and PI (red) were recorded as described in (A). Arrows indicate membrane binding of FITC-PdB. Bar = 20 μm (n = 3). (D) Membrane potential changes detected in HL-1 cells following exposure to PLY (1 μg/ml). Top panel: histogram showing typical resting membrane potential under untreated (UT) conditions and following exposure to PLY presented as Mean±SD (n = 3).* p = 0.01. Bottom panel: Typical action potential of HL-1 cells treated without (UT) or with PLY. (E) Changes of [Ca2+]i of HL-1 cardiomyocytes with fura-2am as an indicator were recorded using the IonOptix. Typical traces before and after PLY or PdB treatment in presence and absence of extracellular Ca2+ are presented. Caffeine (10 mM) was used to induce Ca2+ release from sarcoplasmic reticulum stores within cardiomyocytes.
