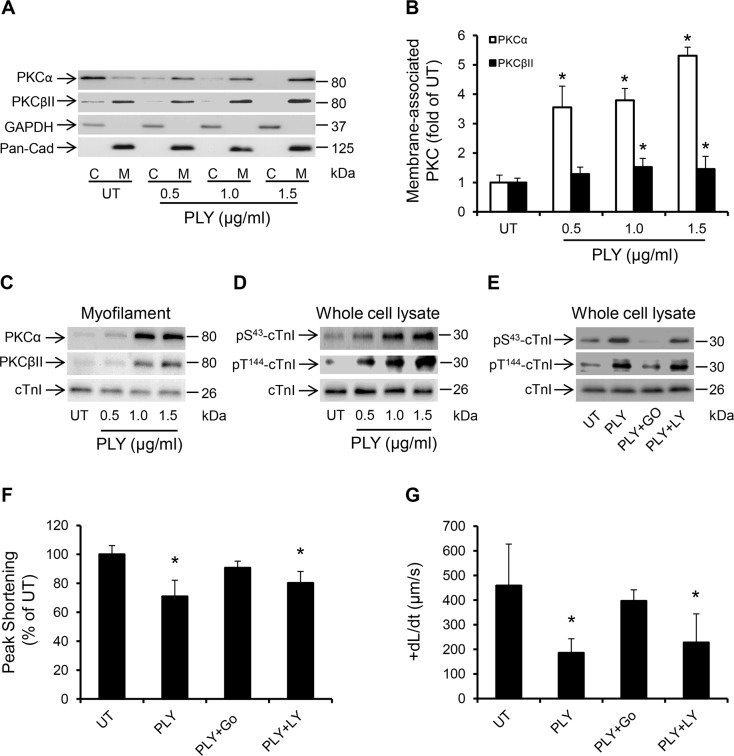
Fig 7. PLY activates the PKCα-cTnI axis in HL-1 cardiomyocytes to depress contractility.
(A) Representative Western blots and (B) a band-quantification histogram showing the distribution of PKCα and PKCβII in the cytosol “C” and membrane “M” fractions of HL-1 cells before (UT) and 30 min after PLY-treatment. GAPDH and Pan-Cadherin were used as markers for “C” and “M” fractions, respectively. Data are presented as Mean±SD (n = 3). * p<0.05 compared to UT. (C-E) Typical Western blots showing PLY effects on the association of PKCα and PKCβII with the myofilament fraction (C), the phosphorylation of cTnI at the S43 and T144 PKC-dependent phosphorylation sites (D) and the effects of PKCα inhibitor Go6976 (5 nM) and the PKCβII inhibitor LY333531 (10 nM) on PLY (1.0 μg/ml)-induced phosphorylation of cTnI at S43 and T144 phosphorylation sites (E) in HL-1 cells after 30 min of PLY treatment. cTnI was used as endogenous control (n = 3). (F) and (G) Effects of PLY (1.0 μg/ml) ± Go6976 (5 nM) or LY333531 (10 nM) on Peak Shortening (F) and +dL/dt (G) after 30 min of PLY treatment. Data are presented as Mean±SD (n = 9). *p<0.05 compared to UT.

