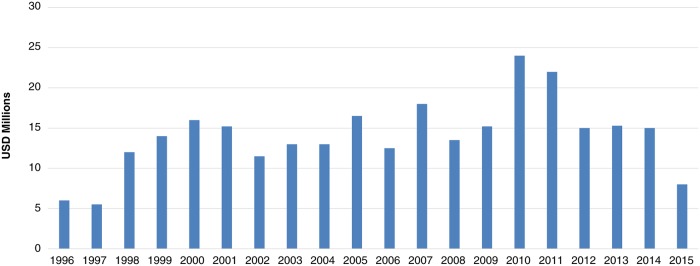
Fig 6. Total receipts: APOC I and II (1996–2015).

Values from 1996–2011 have been deflated using the gross domestic product (GDP) deflator. 2012–2015 values represent the nominal amount.

Values from 1996–2011 have been deflated using the gross domestic product (GDP) deflator. 2012–2015 values represent the nominal amount.