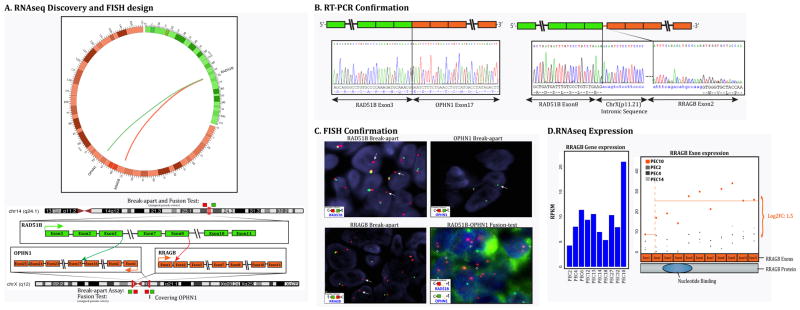
Figure 3. RAD51B-associated gene fusion in uterine PEComa (Case 10).
(A) Schematic representation of the two fusion transcript candidates identified by RNAseq, involving the RAD51B locus on 14q24.1 with RRAGB located on xp11.2, resulting in a t(x;14)(p11.2;q24.1) translocation, and the other involving the RAD51B with OPHN1 gene on xq12 resulting in a t(x;14)(q12;q24.1); (B) Fusion candidates were validated by RT-PCR showing fusion of the RAD51B exon 8 to RRAGB exon 2 with an intervening intronic sequence of Xp11.21, and the fusion of RAD51B exon 3 with OPHN1 exon 17. (C) FISH break-apart assays showing unbalanced rearrangement of RAD51B gene (arrows) with loss of the telomeric signal (upper left). FISH break-apart assay showing unbalanced rearrangement of RRAGB gene (arrows) on Xp11.21 with loss of the telomeric signal (lower left); FISH for OPHN1 gene on Xq12 showing loss of one copy of signals, indicating a larger deletion at this locus (upper right). The RAD51B-OPHN1 fusion assay (lower right) showing fusion of the RAD51B (red) with a small fragment of OPHN1 (green) gene (arrows), suggesting a deletion in the OPHN1 gene locus. (t-telomeric; c-centromeric) (D) Bar chart showing increased expression of RRAGB in PEC10 compared to other PEComas. The dot plot further shows the differential exon expression of RRAGB (case 9, after the exon 2 breakpoint) compared to other PEComas.

