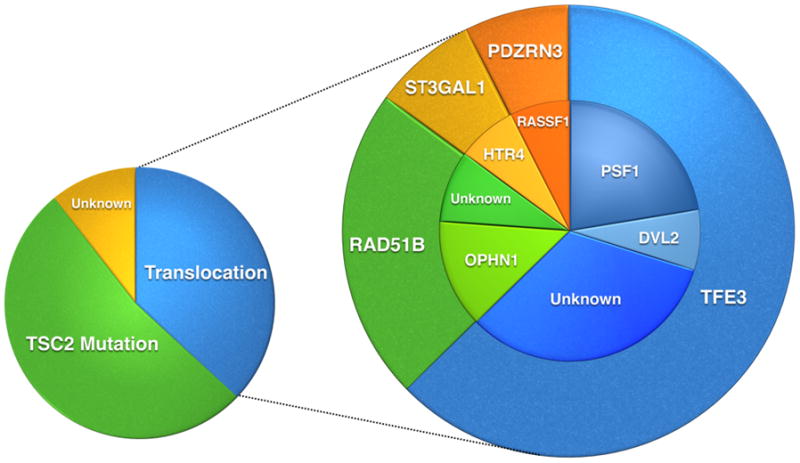
Figure 5. Schematic pie chart representing the genetic findings in PEComas.

The larger pie chart demonstrates the different translocations identified in PEComas. The smaller pie on the left shows the different genetic subgroups in PEComa with a predominant group showing TSC2 mutations, a second group with translocations, and a smaller group with unknown genetic alterations.
