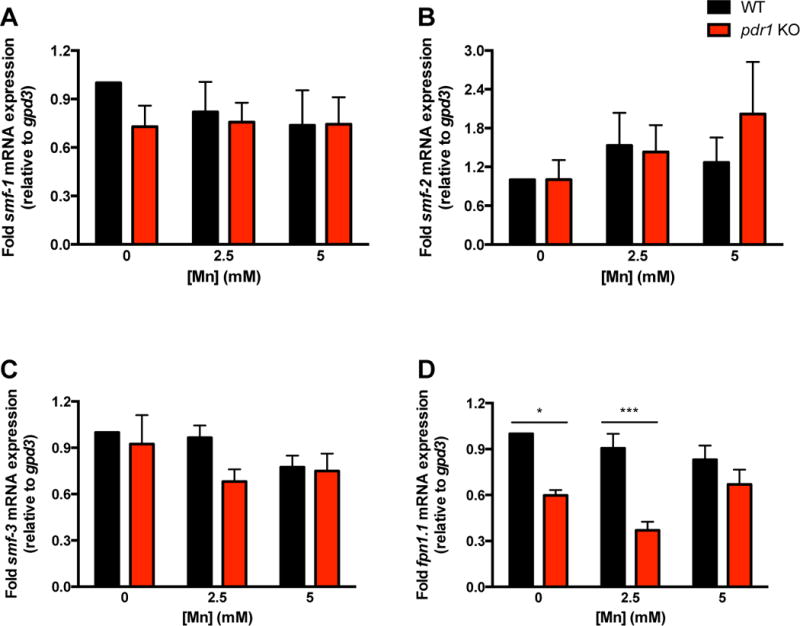
Fig. 1. pdr-1 mutants show alterations in mRNA expression of Mn exporter, but not importer, genes.

(A-D) smf-1,2,3 and fpn-1.1 mRNA expression after an acute, 30 min treatment of L1 worms with 0, 2.5 and 5 mM MnCl2. Relative gene expression was determined by qRT-PCR. (A) smf-1 mRNA expression in N2 (WT) and pdr-1 KO animals. (B) smf-2 mRNA expression in N2 (WT) and pdr-1 KO animals. (C) smf-3 mRNA expression in N2 (WT) and pdr-1 KO animals. (D) fpn-1.1 mRNA expression in N2 (WT) and pdr-1 KO animals. (A-D) Data are expressed as mean values + SEM of at least five independent experiments in duplicates normalized to the untreated wildtype and relative to gpd3 mRNA. Statistical analysis by two-way ANOVA: (A) interaction, ns; genotype, ns; concentration, ns; (B) interaction, ns; genotype, ns; concentration, ns; (C) interaction, ns; genotype, ns; concentration, ns; (D) interaction, ns (trend level, p=0.0639); genotype, p<0.0001; concentration, ns. *p < 0.05, ***p < 0.001 vs. respective wildtype worms.
