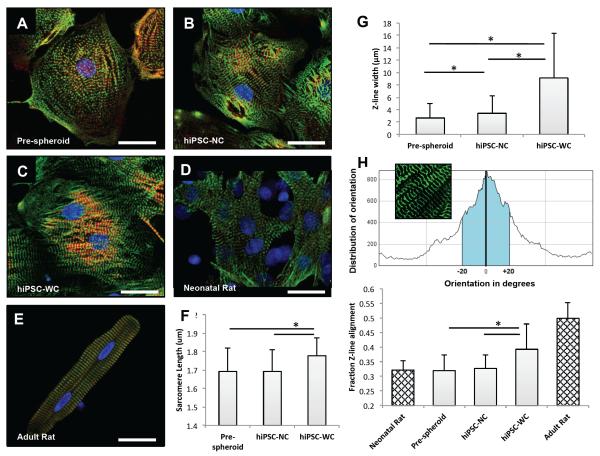
Figure 6. Single cell analysis of hiPSC-derived cardiomyocytes before and after spheroids, and rat-neonatal and adult cardiomyocytes.
(A) Fluorescent confocal images (green, α-sarcomeric actinin (α-SA); red, troponin I; blue, DAPI nuclear stain) of single cells harvested before hiPSC spheroid fabrication, (B) after 7 days from hiPSC-NC spheroids, (C) and after 7 days from hiPSC-WC spheroids. (D) Rat-neonatal cardiomyocyte and (E) adult left ventricular cardiomyocyte for morphological comparison. (F) Sarcomere length measured as distance between α-SA-stained Z-line structures from cardiomyocytes with visible sarcomere structures; n = 9 cells per condition. (G) Z-line width measurements based on α-SA-stained Z-line structures in comparison to neonatal and adult rat cardiomyocyte references; n = 10 cells per condition. (H) Z-line alignment calculations were based on a fraction (±20° of the peak orientation degree) of aligned α-SA-stained structures; n = 12 cells (hiPSC), 4 cells (rat) per condition. hiPSC-NC= human induced pluripotent stem cell cardiac spheroids, no e-SiNWs, no stimulation; hiPSC-WC= human induced pluripotent stem cell cardiac spheroids, with e-SiNWs, no stimulation. Asterisks (*) represent statistical significance with p<0.05; error bars represent standard deviation. Scale bars = 25 μm.

