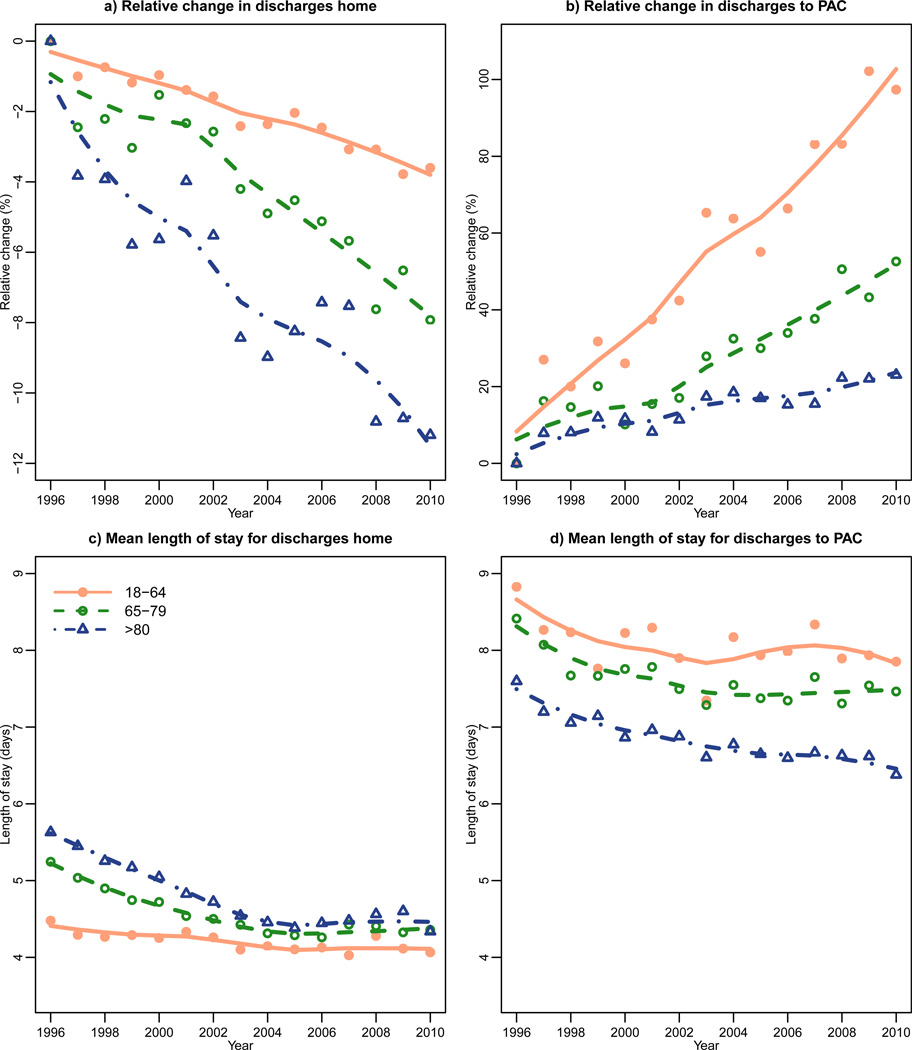
Figure 1. Trends in length of stay and discharges to post-acute care and home, stratified by age group.
Trends in the percentage of patients discharged home or to post-acute care facilities (PAC) are shown using loess smoothing (data points are represented as filled circles, unfilled circles, and unfilled triangles, respectively as age increases with trend lines fit to these data point). Trends are calculated as a relative percent change compared to 1996 levels. Length of stay is reported as mean number of days.For 18–64 year-olds discharged to PAC, slope of line is 6.54 (95% CI 5.64– 7.45) with p-value <0.001. For 65–79 year-olds discharged to PAC, slope is 3.20 (2.58– 3.83) with p-value <0.001. For those 80 and above discharged to PAC, slope is 1.313 (0.99– 1.63) with p-value <0.001.

