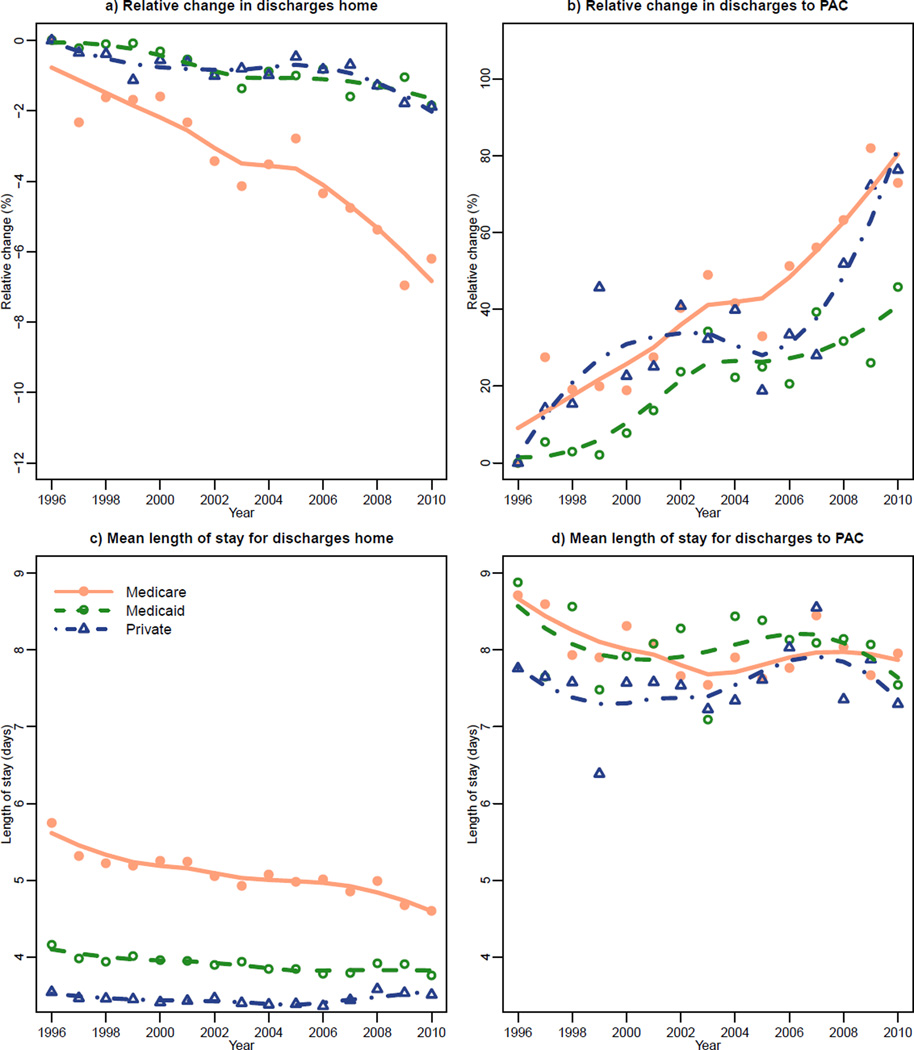
Figure 2. Trends in length of stay and discharges to post-acute care and home, stratified by payor source.
Trends in the percentage of patients discharged home or to post-acute care facilities (PAC) are shown using loess smoothing (data points are represented as filled circles, unfilled circles, and unfilled triangles, respectively). Trends are calculated as a relative percent change compared to 1996 levels. Length of stay is reported as mean number of days. For those discharged to PAC, among Medicare patients slope is 4.69 (95% CI 3.69– 5.69; p-value <0.001), among Medicare patients slope is 2.85 (2.05–3.65; p-value <0.001), and among patients with private insurance slope is 3.617 (1.99–5.24; p-value 0.001).

