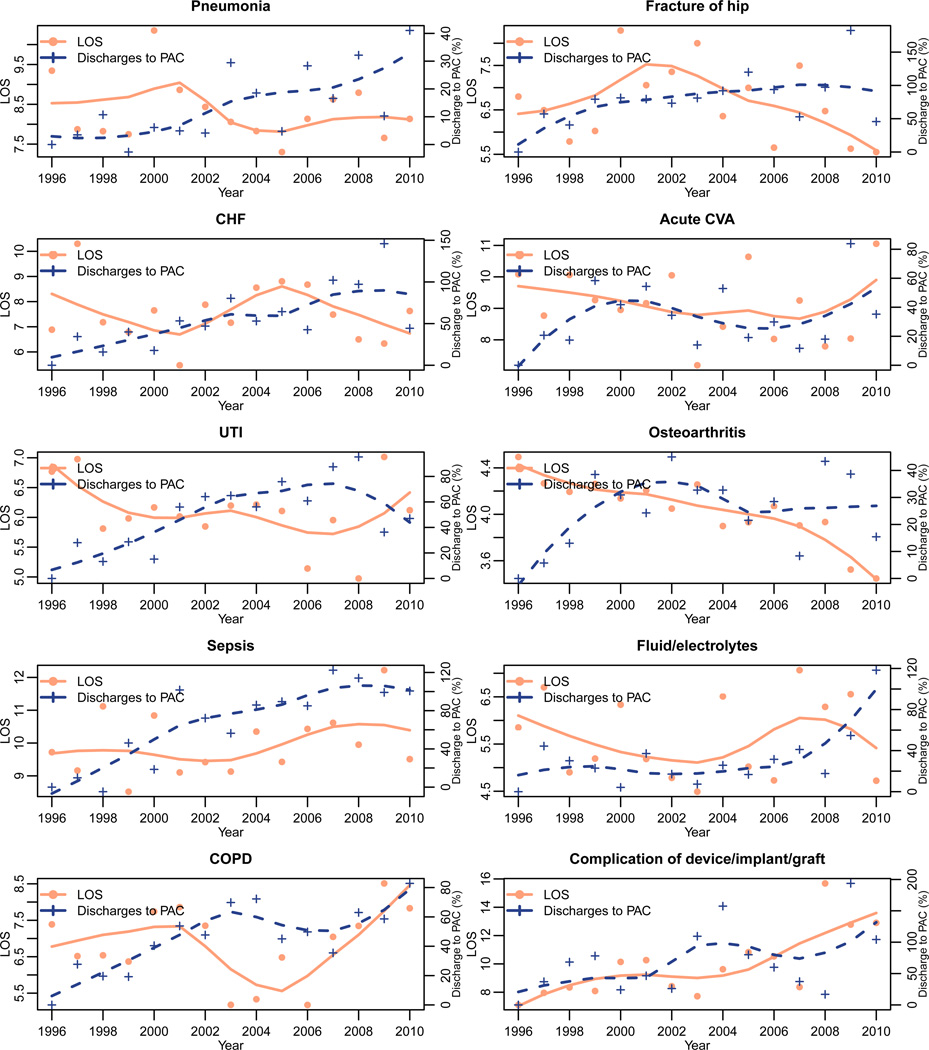
Figure 3. Trends in length of stay and discharges to post-acute care by diagnosis.
Trends in mean length of stay (left Y-axis, filled circles) and relative percent change in discharge to PAC compared to 1996 levels (right Y-axis, + signs) are displayed over time within each of the ten most common diagnoses associated with discharge to PAC; trend lines are fit using loess smoothing. Trends are adjusted for age and for payor type.

