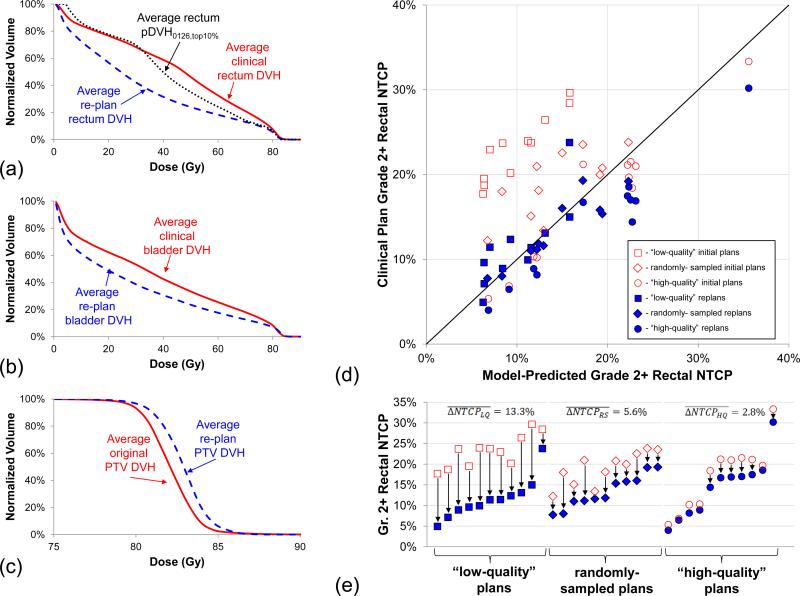
Fig.4.
Re-planning validation of pDVH predictions. (a)Average rectum DVHs from the 30-patient re-planning sample shows that pDVH0126,top10% predictions were not only possible but could be further improved. (b)Re-plan bladder DVHs were also significantly improved. (c)Holding PTV V100% fixed, average re-plan PTV DVH exhibited more heterogeneity than the clinical DVHs as the cost of OAR dose reductions. (d)Rectal NTCP scatter plot shows model-predicted NTCP vs. the original plans’ NTCP, which included 10 “high-quality” protocol plans (circles), 10 “low-quality” protocol plans (squares), and 10 randomly-sampled protocol plans (diamonds), with clear gains in the re-plans (closed markers) over clinically-delivered plans (open markers). (e)Comparing quality groups, average NTCP reductions were greatest in the “low-quality” plans.

