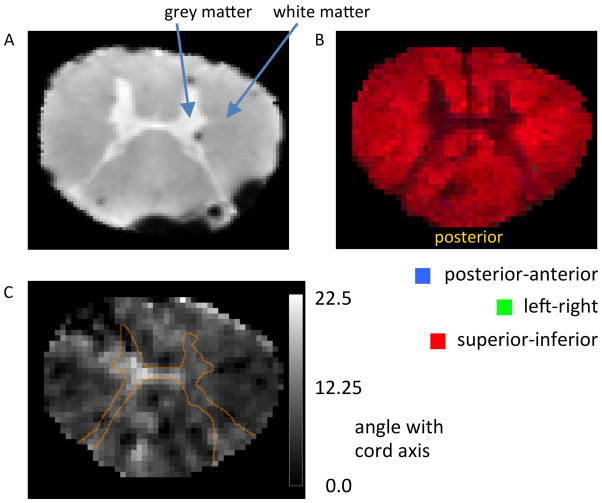
Figure 2.
Axial images of a human spinal cord sample, showing white and grey matter distribution and microstructural fiber alignment as assessed by MRI. (A) Grey matter occupies a relatively small tissue fraction centrally located in the sample. The dark spots result from magnetic susceptibility effects caused by small air bubbles. (B and C) Diffusion-weighted MRI demonstrating consistent fiber alignment along spinal cord. (B) Diffusion anisotropy, with composite color indicating the direction of the dominant diffusion eigenvector (37), primary colors represent orientations along (red), and perpendicular to (green and blue) the cord axis. (C) Deviation of the angle of the dominant eigenvector with respect to the cord axis, in degrees. The thin orange line represents outline of grey matter (based on the FA map, see Methods). The low values seen in white matter confirm consistent alignment with cord axis (SD=4.8°).

