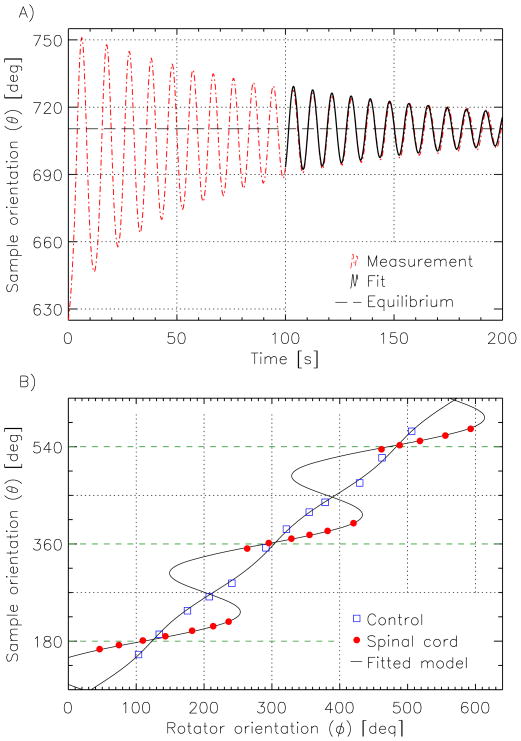
Figure 4.
Extraction of equilibrium orientations and anisotropic susceptibility values. (A) The new equilibrium position of the sample after a change in rotator wheel position was estimated by fitting a damped sinusoid (solid black line) to the tail end of the oscillatory sample motion (dashed red line). (B) A plot of each equilibrium position of the sample against the position of the rotator wheel reveals the markedly different behavior of the spinal cord tissue (red dots) compared to the water reference (blue squares). The curves show the results of fitting Eq. [4] to these data; regions with negative slopes represent unstable orientations. The horizontal green dashed lines indicate orientations parallel to the magnetic field.

