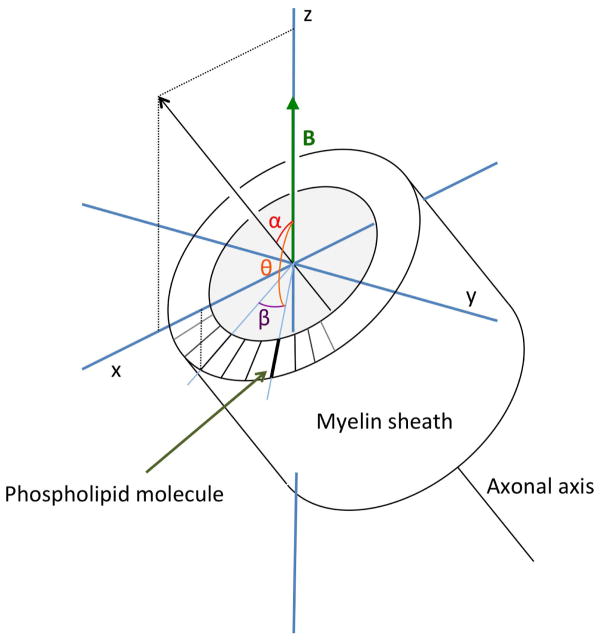
Figure A1.
Illustration of the relation between macroscopic-, and molecular-scale anisotropy as calculated in Appendix 3. β is the angle of myelin phospholipid molecule with the x-axis in a plane perpendicular to the axis of rotational symmetry, α is the angle of this axis with B̄0, and θ the angle of the molecular axis with B̄0. The macroscopic anisotropy, related to α, is the average of the molecular orientation effects, characterized by θ, which in turn is a function of α and β.

